A Quick Start Guide to Why Conversion Rate Shifts Between Page Types

Why Does Conversion Rate Change When Traffic Shifts Between Page Types?
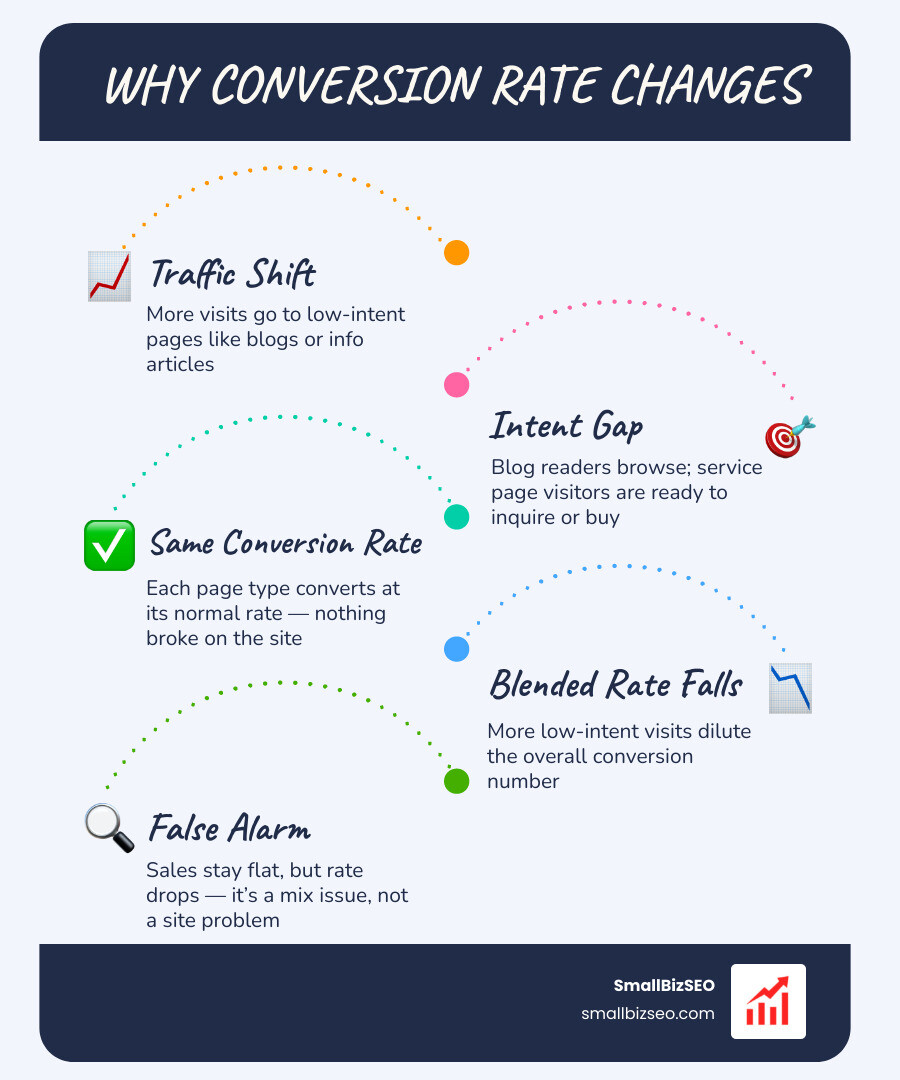
Here's why conversion rate changes when traffic shifts between page types: different pages attract visitors with different goals. A service page may draw people ready to inquire, while a blog post may draw people still learning. If more visits go to blog posts, the site's overall conversion rate can fall even when each page type performs as well as before.
If visits rise but sales stay flat, the same number of sales is being divided by more visits. Before changing a page, compare conversion rates by page type and traffic source. That helps you tell a traffic-mix shift from a problem with the site.
I'm Clayton Johnson, founder of SmallBizSEO. My work connecting SEO content, search intent, and qualified leads shapes how I explain why conversion rate changes when traffic shifts between page types.
When evaluating digital performance, looking at a single aggregate conversion metric often obscures user behavior. A website is an ecosystem of distinct assets: informational articles, commercial service pages, transactional checkout flows, and standalone paid campaign landers.
Data across large-scale performance studies confirms that conversion baselines fluctuate drastically by page template and user objective:
| Page Type | Primary User Intent | Typical Conversion Rate Range | Primary Action / Goal |
|---|---|---|---|
| Pricing / Quote Page | Transactional | 8.0% – 12.0% | Form submission, checkout start |
| Dedicated Landing Page | Commercial / Focused | 6.0% – 11.5% | Single-offer conversion |
| Service Page | Commercial Investigation | 2.0% – 4.0% | Inquiry, phone call |
| Homepage | Navigational / Discovery | 1.5% – 3.0% | Internal routing, brand overview |
| Informational Blog Post | Top-of-Funnel Educational | 0.2% – 0.8% | Newsletter signup, resource download |
When marketing initiatives succeed in driving thousands of new top-of-funnel readers to informational content, those visits add massive volume to the denominator without contributing immediate sales to the numerator. The site has not become worse at converting customers; rather, the composition of visitor intent has redistributed.
What Is the Simpson’s Paradox Effect in Conversion Rate Reporting?
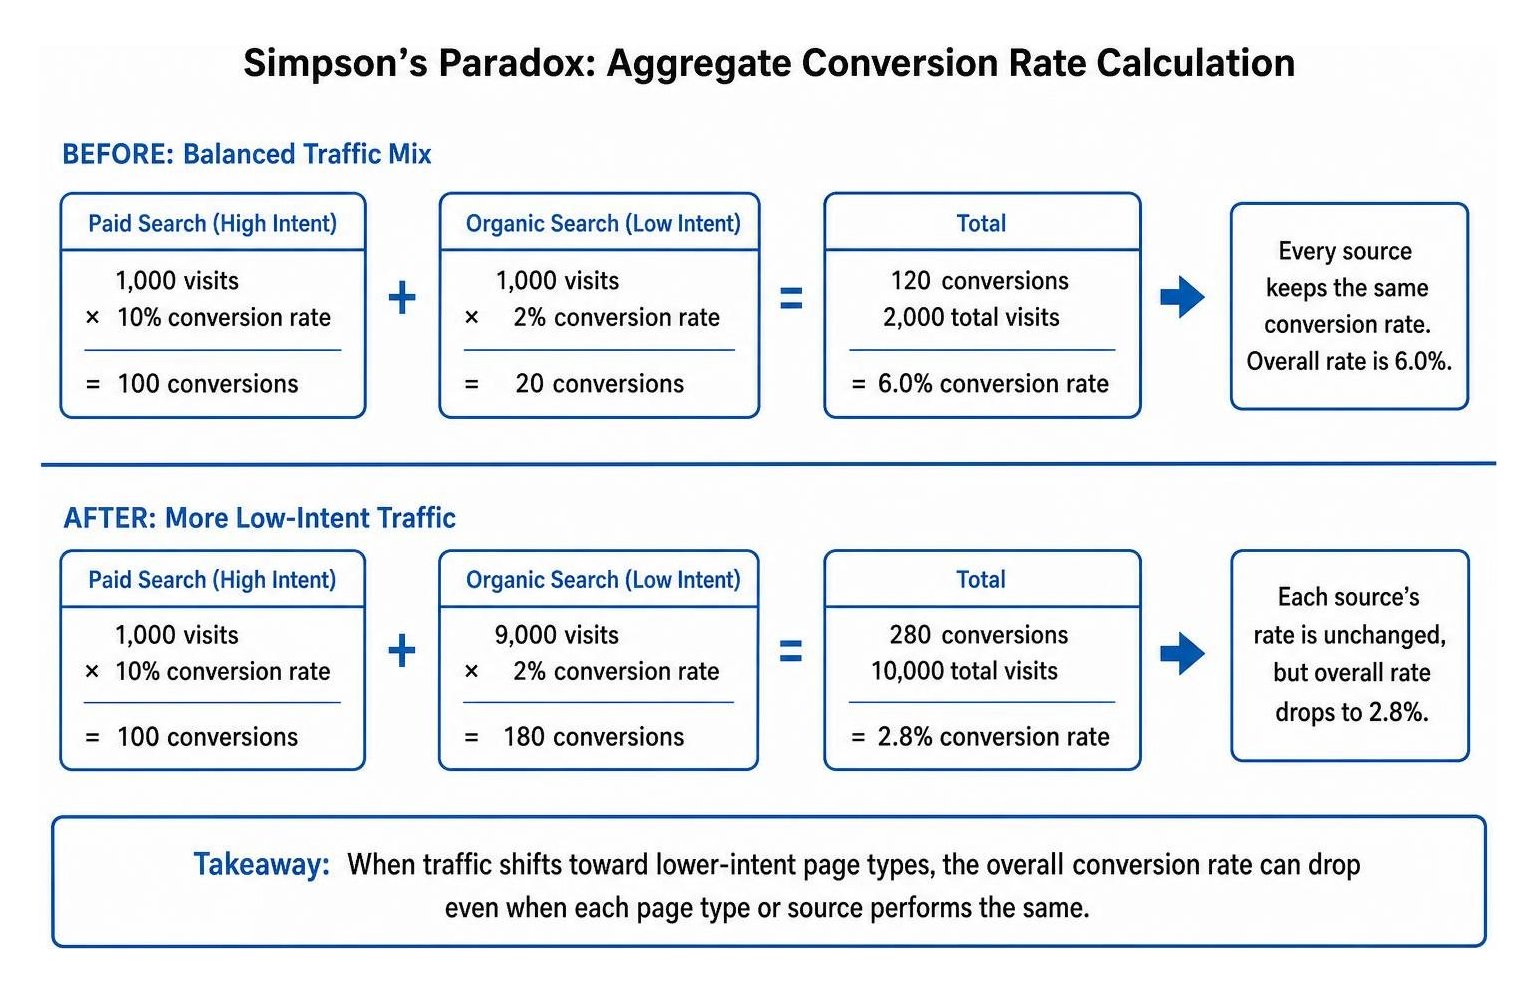
Direct Answer: Simpson’s Paradox occurs when every individual page type or marketing channel maintains a steady conversion rate, yet the site-wide aggregate conversion rate drops significantly due to a shift in traffic weighting.
Consider a scenario where an e-commerce or lead generation business tracks two main traffic paths: high-intent paid search directed to product pages, and educational organic search landing on informational articles.
Suppose paid search delivers 1,000 visits converting at 10% (100 conversions), while organic search delivers 1,000 visits converting at 2% (20 conversions). The combined performance reflects 120 conversions across 2,000 total sessions, yielding an overall conversion rate of 6.0%.
Now suppose a content strategy scales quickly, increasing organic sessions to 9,000 visits while maintaining that same 2% rate (180 conversions). Paid search remains constant at 1,000 visits and 10% (100 conversions).
When examining the aggregate performance:
- Total conversions grew from 120 to 280 (a 133% increase in real business volume).
- Total visits grew from 2,000 to 10,000.
- The blended conversion rate fell from 6.0% to 2.8%.
Without granular segmentation, leadership might assume the website experienced a major failure. In reality, every single page maintained its conversion efficiency. The lower site-wide number is simply a mathematical byproduct of low-intent volume dilution.
Should You Send Traffic to a Service Page or a Landing Page?
Direct Answer: Use service pages to rank for organic search queries within the broader site architecture; send targeted paid advertising traffic to dedicated landing pages designed without navigation links to maximize conversion focus.
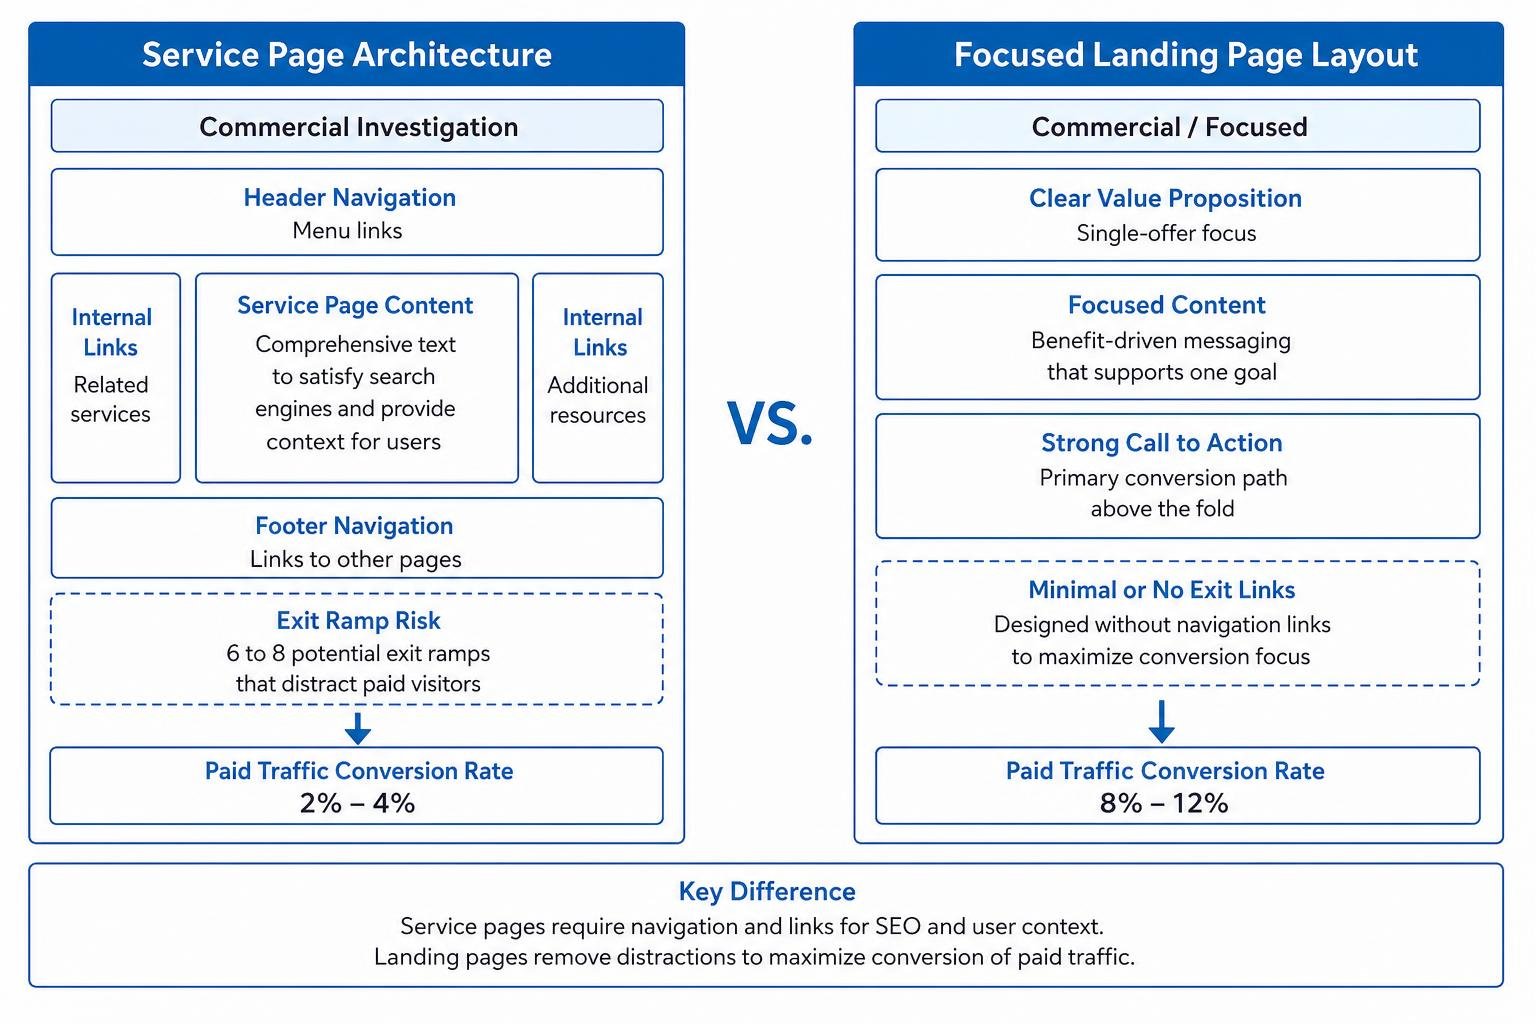
A fundamental mismatch occurs when teams direct paid clicks to general service pages. Service pages require comprehensive text, internal links, header menus, and footer navigation to satisfy search engine crawling and provide context for browsing users. These structural elements serve as 6 to 8 potential exit ramps that distract paid visitors.
Industry comparisons demonstrate that dedicated landing pages convert paid traffic at 8% to 12%, whereas standard service pages convert paid traffic at only 2% to 4%. Sending paid ad clicks to standard service pages can waste 50% to 70% of ad spend due to lost focus.
Key design elements that separate these two page types include:
- Navigation Elimination: Removing the global navigation header on paid landing pages can lift conversion rates by up to 36% by removing non-converting click paths.
- Message Matching: Landing pages designed for specific campaigns allow headline copy to mirror ad text precisely. Perfect message match between ad copy and page copy increases conversions by up to 39%.
- Lead Qualification: Service pages excel at educating prospects and generating a qualified organic lead over multi-session journeys, whereas campaign landers capture direct, immediate intent.
Why Can High-Glance Views Lead to Lower Conversion Rates?
Direct Answer: High-glance view traffic indicates casual browsing where visitors review product details or scan information without an immediate intent to buy, diluting conversion rates compared to highly targeted purchase visits.
In digital retail and service platforms, page views do not all carry equal commercial intent. A high volume of glance views with low conversion numbers usually indicates that visitors are in an early research mode, comparing options, checking specifications, or assessing prices across multiple competitors.
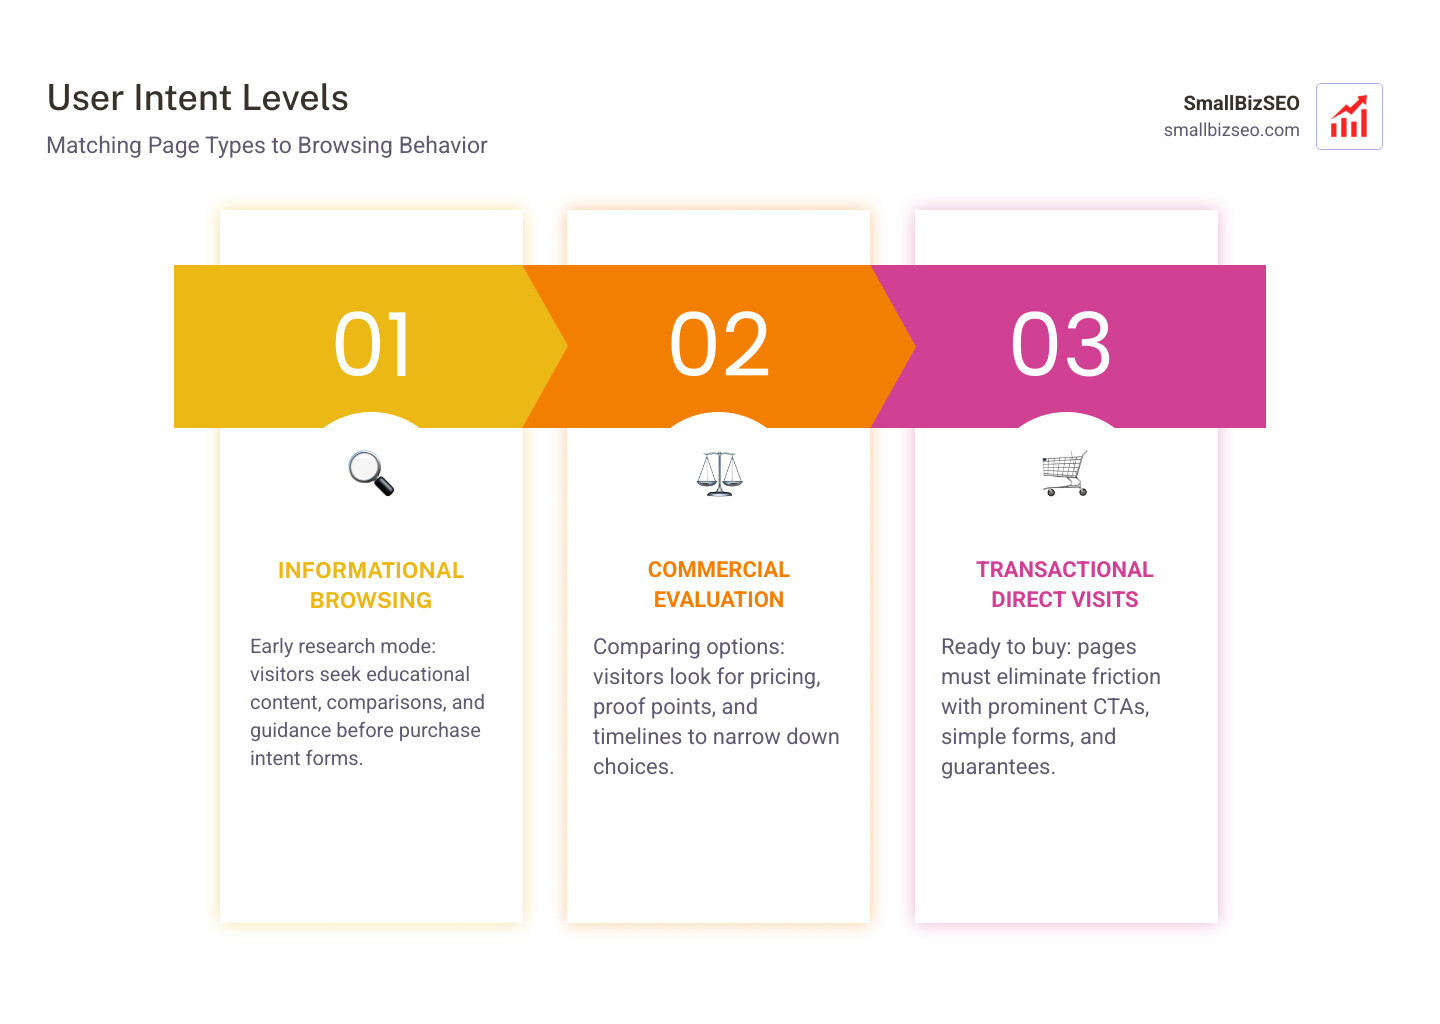
Aligning page structures with user intent requires clear content differentiation:
- Informational Browsing: Visitors seeking advice need educational context, transparent comparison charts, and clear guidance before they are ready to purchase.
- Commercial Evaluation: Aligning pages with a targeted buyer intent keyword ensures visitors find specific pricing tiers, customer proof points, and explicit delivery or turnaround timelines.
- Transactional Direct Visits: Pages capturing bottom-of-funnel queries must eliminate friction entirely by featuring prominent buttons, simple form fields, and transparent guarantees to achieve a proper search intent match.
How Do You Diagnose and Resolve Conversion Rate Differences Across Pages?
Direct Answer: Audit your tracking setup and channel segmentation first to isolate traffic composition changes; if conversion rates drop across all channels simultaneously, inspect technical site speed, mobile responsiveness, and checkout mechanics.
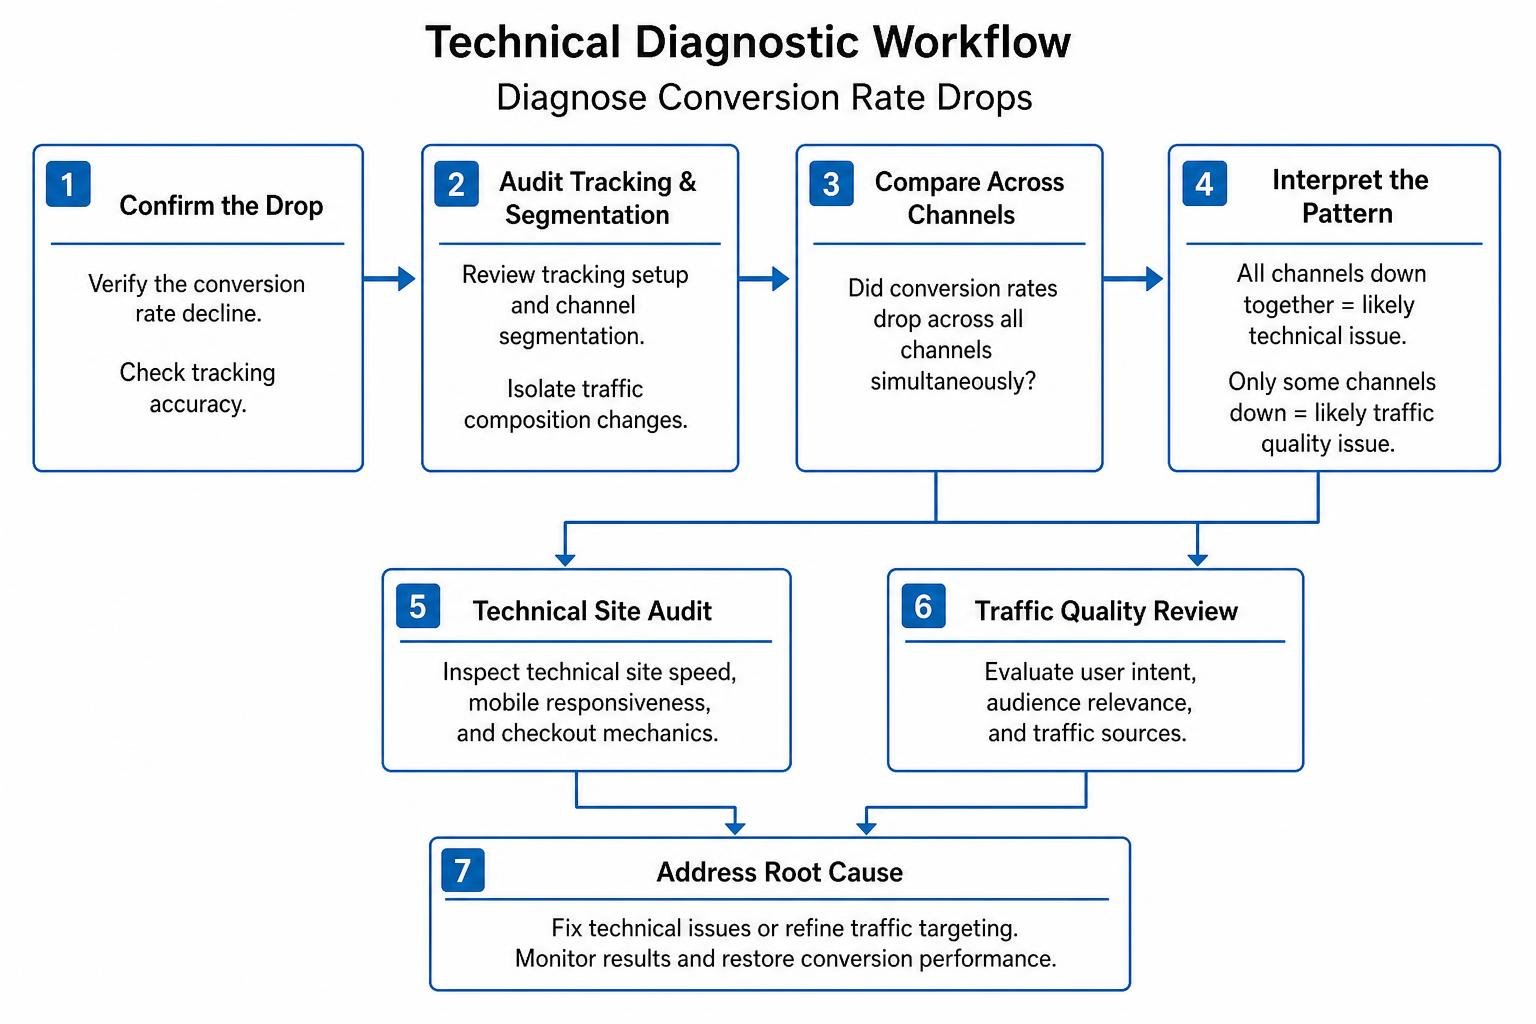
When an unexpected conversion downturn occurs, use a structured diagnosis to identify the root cause before altering landing page copy or modifying active campaigns.
At SmallBizSEO, we implement our data-driven Velocity framework to rapidly diagnose and address these performance shifts. By systematically isolating traffic acquisition changes from technical infrastructure, teams can quickly restore both ranking velocity and lead capture.
Is a Conversion Rate Drop Caused by Traffic Quality or a Technical Site Issue?
Direct Answer: If only one channel or low-intent page group experiences lower conversion while others remain stable, traffic quality has shifted; if every page and traffic source suffers a simultaneous drop, a technical error or site speed degradation is the primary cause.
To determine where the issue originates, evaluate these areas:
- Site Latency and Core Web Vitals: Page load performance directly governs user action. Conversion rates drop by an average of 0.3% for every single additional second of page load time.
- Tracking Code Reliability: Confirm that script tags, Google Tag Manager containers, and event triggers have not been corrupted during recent site updates. Always begin troubleshooting by validating conversion tracking setup across primary and secondary user actions.
- Mobile Funnel Integrity: Over 60% of web traffic occurs on mobile devices. A checkout flow or form that displays properly on desktop may break on mobile screens, creating severe conversion drops that do not appear in desktop-only audits.
- Audience Targeting Drift: Check whether recent paid campaign expansions or broad match keyword changes brought in unqualified clicks, inflating impressions while failing to produce paying customers.
When you isolate the root factor, you can execute targeted adjustments to continue improving conversion rate metrics across high-value URLs.
How Can You Track Page-Type Conversion Rate Changes in GA4?
Direct Answer: Organize reporting using custom page-location groupings and session key event rates in Google Analytics 4, ensuring UTM campaign tagging cleanly separates top-of-funnel content from bottom-of-funnel landing pages.
Accurate measurement in GA4 requires moving past aggregate metrics and tracking individual funnel stages. Relying on default channel overviews without page context causes teams to misinterpret normal traffic redistribution as performance loss.

Implement these best practices for clean GA4 analysis:
- Track Key Event Rates by Session: Use the Session Key Event Rate dimension rather than user-level metrics to assess how effectively specific page sessions produce target outcomes.
- Establish Clear Page Taxonomies: Classify URLs into distinct folder structures (such as
/blog/,/services/, and/lp/) so performance can be evaluated across page categories rather than as a single combined average. - Standardize UTM Parameters: Ensure all paid, email, and social links utilize consistent campaign source, medium, and content tags to prevent paid traffic from blending into direct or unassigned buckets.
- Run Controlled Experiments: When testing layout changes, ensure test variants use appropriate canonical tags to prevent duplicate indexing issues. Track results methodically by running controlled tests with an ab testing workbook until reaching statistical significance with at least 100 conversions per variant over a 3- to 4-week window.
Practical Next Steps for Aligning Traffic and Page Types
Understanding why conversion rates fluctuate across page categories allows you to make data-backed marketing decisions without reacting to misleading top-line numbers.
Begin by auditing your site architecture: protect your educational blog posts for organic search growth, optimize dedicated service pages for local and commercial buyers, and reserve stripped-down, focused landing pages for paid campaigns. By measuring each asset against its intended business objective, you turn raw analytics into clear, reliable revenue growth.