Are Your Web Vitals Actually Improving in CrUX Dashboard Reports?

Are Your Web Vitals Actually Improving in CrUX?
To interpret CrUX trends after a performance improvement, compare the 75th-percentile metric for the affected URL before and after the fix. Check mobile and desktop separately, and match the trend to your deployment date. Look for movement in the metric you targeted, such as LCP after an image fix, rather than relying on the overall “Good” status alone.
Don’t judge the fix from the first report. CrUX combines real Chrome visits over a rolling 28-day period, so older visits can hide a new gain. Keep checking as those visits leave the window. If the trend looks worse, check whether your traffic mix or another site change shifted at the same time.
I’m Clayton Johnson, founder of SmallBizSEO, where I help small businesses connect technical SEO work with clear reporting. I’ll show you how to interpret crux trends after a performance improvement so you can tell a delayed result from a problem worth investigating.
How to Interpret CrUX Trends After a Performance Improvement: Timelines, Delays, and Rolling Windows
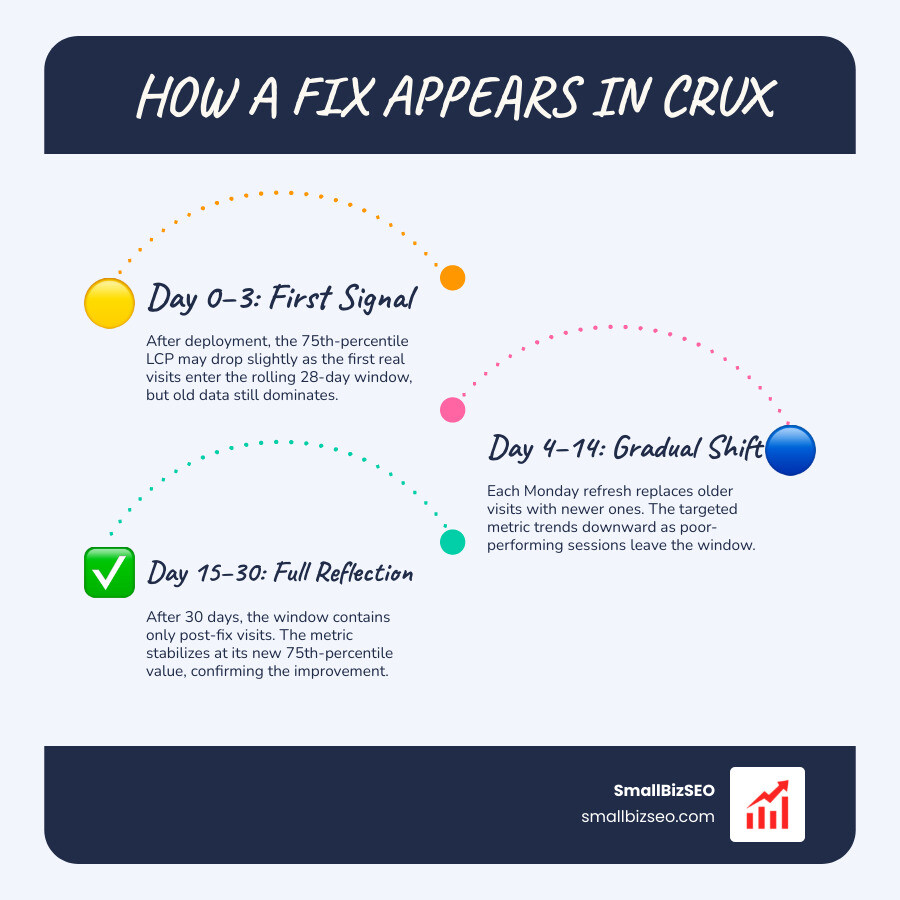
Direct answer: Chrome User Experience Report (CrUX) data operates on a 28-day rolling collection window with a 2-day processing delay, meaning you will see subtle early signals within 3 days of a deployment, but complete validation requires a full 30 days.
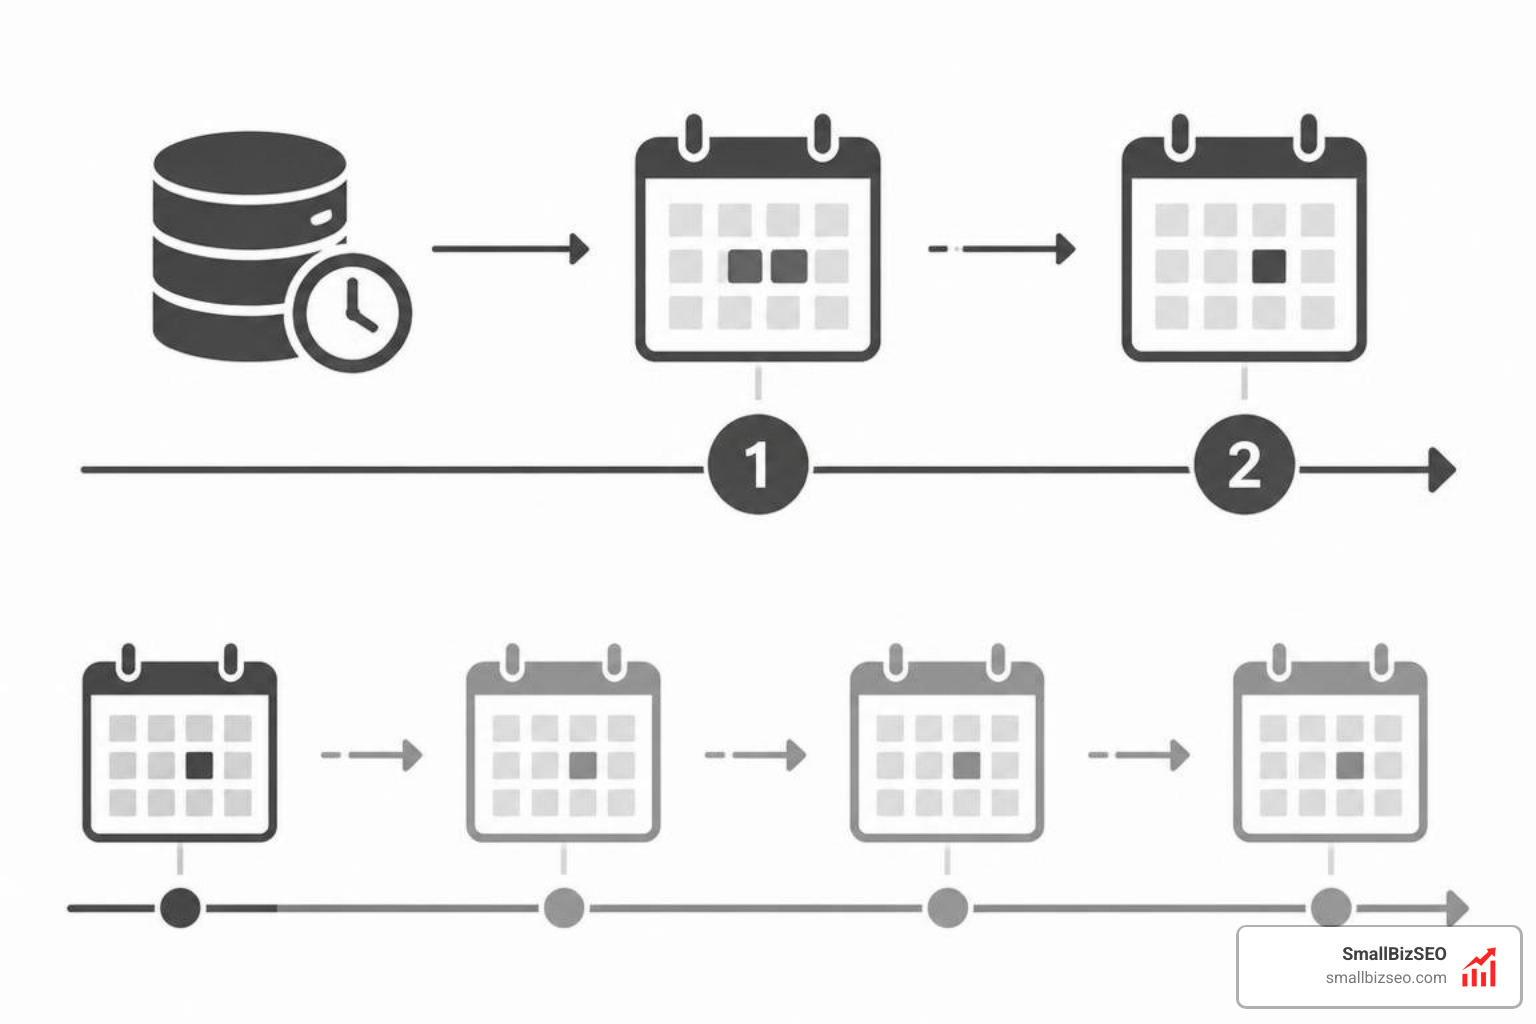
When monitoring real-user experience through crux or tools like Pagespeed Insights, timing is everything. Because CrUX aggregates field data continuously across real visitors using Google Chrome, every daily snapshot represents the preceding 28 days of traffic.
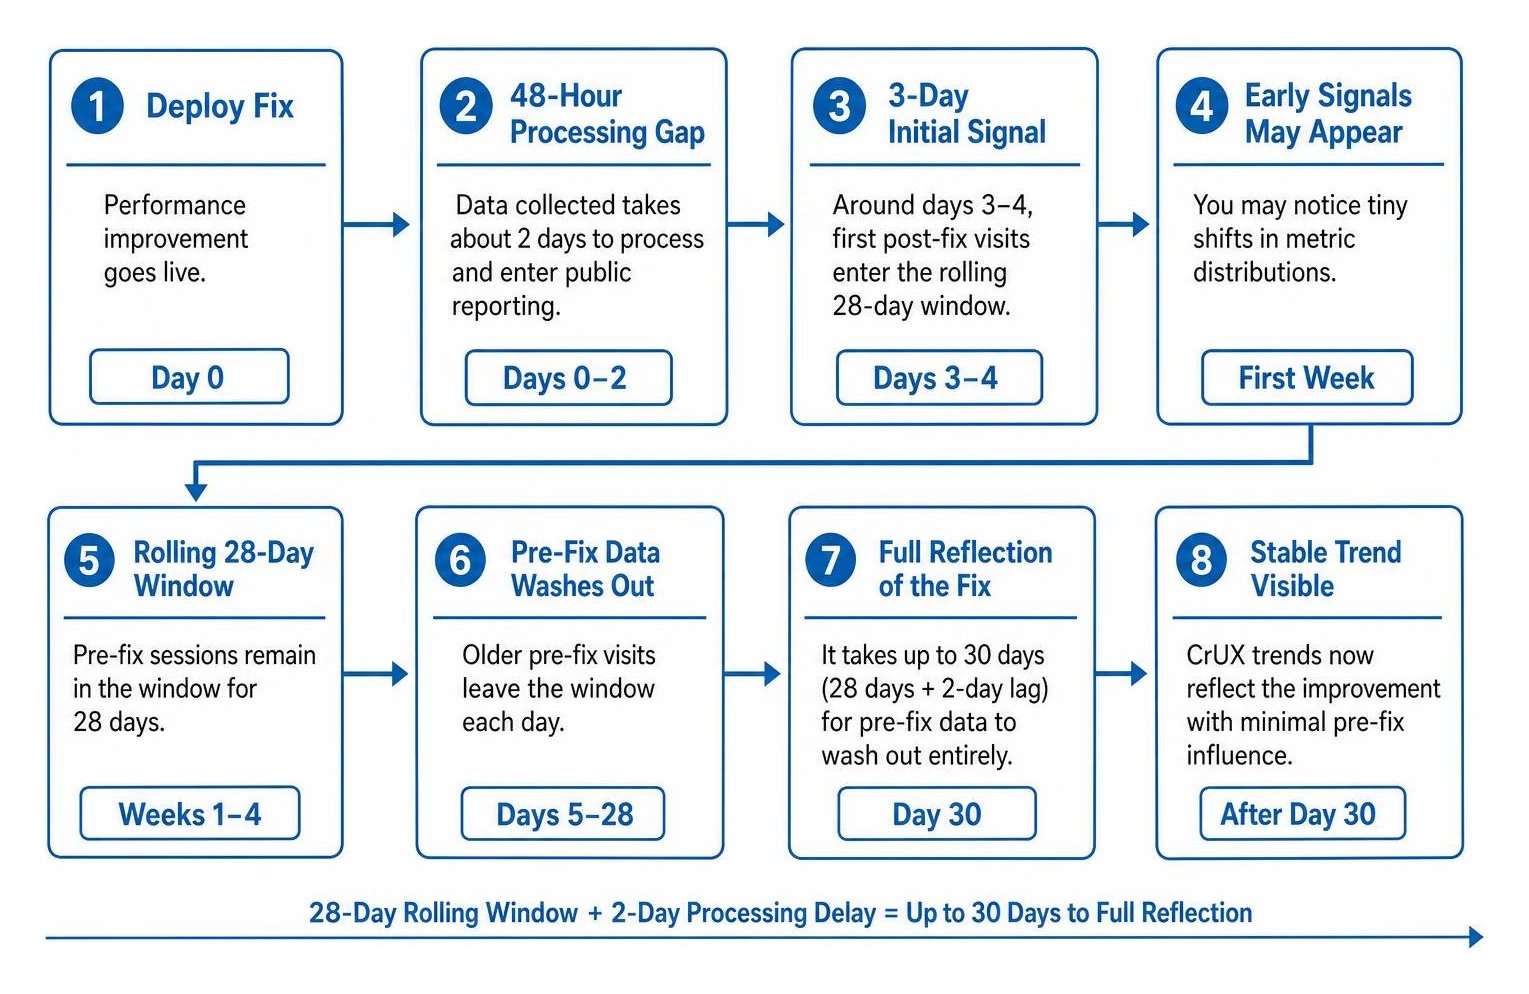
The timeline unfolds in three distinct phases:
- The 48-Hour Processing Gap: Data collected on a given day takes about two days to process and enter public reporting pipelines. If you deploy a fix on Monday, that day's improved sessions do not enter the dataset until Wednesday.
- The 3-Day Initial Signal: Around three to four days after deployment, the first batch of post-optimization user visits enters the rolling dataset. You may notice tiny shifts in metric distributions.
- The 30-Day Full Reflection: Because the pre-optimization user sessions linger in the rolling window for 28 days, it takes up to 30 days (28 collection days plus the 2-day lag) for your pre-fix data to wash out entirely.
Additionally, the CrUX History API refreshes weekly every Monday around 04:00 UTC, providing aggregated historical points representing data up through the previous Saturday.
Why Does CrUX Data Lag Behind Lab Tests After a Release?
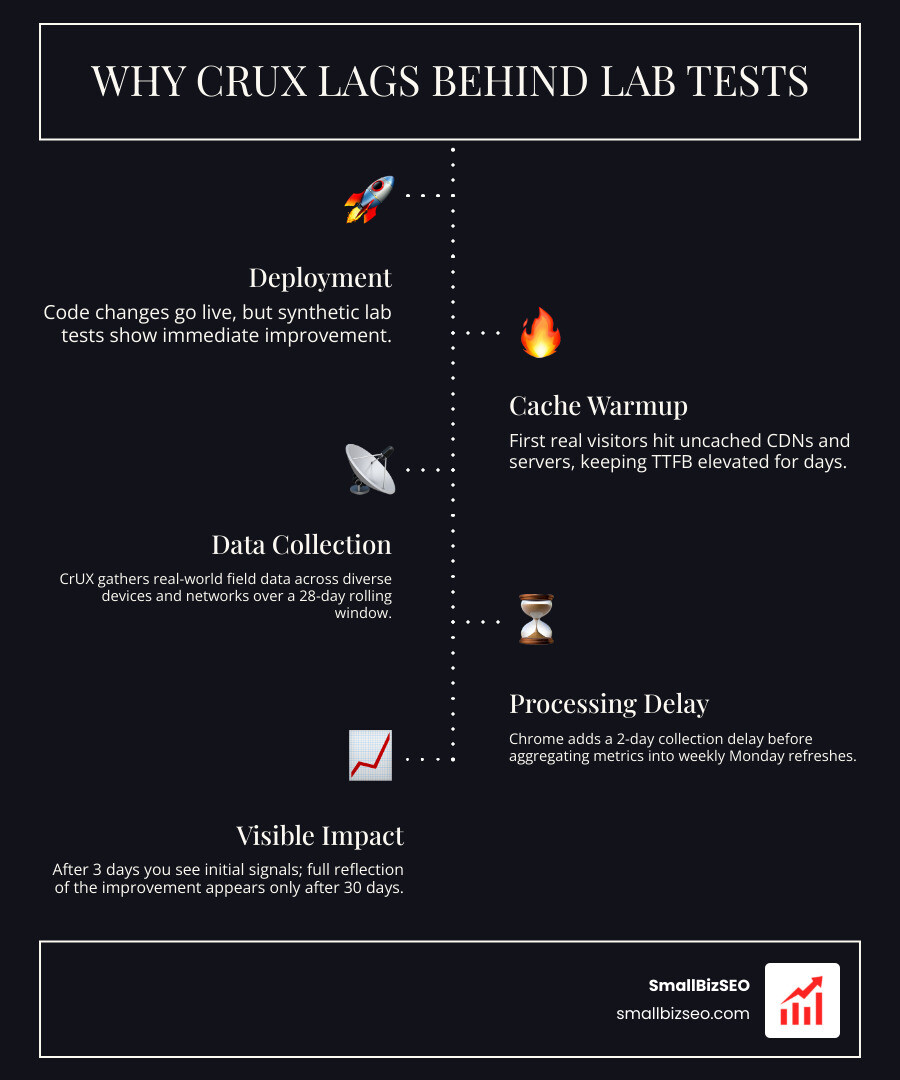
Direct answer: Synthetic lab tests run instantly under controlled, simulated conditions, whereas CrUX aggregates diverse real-world visits that depend on real device hardware, varying cellular networks, and server-side cache warmups over time.
Synthetic tools measure the page at a single moment on standardized hardware. Real visitors, however, visit your pages across budget smartphones, congested mobile networks, and unprimed edge caches. If your backend optimization relies on caching, the earliest post-release visitors may experience uncached response times, keeping initial ttfb elevated.
As user traffic warms up content delivery networks and browsers cache updated scripts, fcp and lcp progressively improve in field measurements.
| Feature / Factor | Synthetic Lab Testing (Lighthouse) | Real-User Field Data (CrUX) |
|---|---|---|
| Feedback Speed | Instant (seconds after test execution) | Gradual (3 to 30 days rolling) |
| Network Conditions | Simulated, throttled fixed profile | Variable (real-world 3G, 4G, 5G, Wi-Fi) |
| Device Hardware | Emulated mid-tier CPU/GPU | Thousands of unique consumer devices |
| User Interaction | Simulated scripts or zero interaction | Real user clicks, taps, scrolls, and typing |
| SEO Ranking Impact | Diagnostic guidance only | Powers Core Web Vitals ranking evaluation |
How Does the 75th Percentile Differ from Averages in Trend Analysis?
Direct answer: CrUX evaluates Core Web Vitals using the 75th percentile (p75) rather than arithmetic averages, ensuring that at least 75% of user page loads meet performance thresholds while preventing rare statistical outliers from skewing your trends.
An average score can easily conceal poor user experiences or make a healthy site look broken. For instance, if nine users experience a blistering 1.0-second Largest Contentful Paint and one user on an ancient cellular connection experiences a 20-second delay, the average LCP becomes 2.9 seconds (failing the "Good" standard). However, the 75th percentile filters out that extreme outlier, accurately reporting a fast 1.0-second experience for the vast majority of visitors.
To earn a "Good" rating in CrUX, your site must achieve:
- Largest Contentful Paint (LCP): 2.5 seconds or faster at p75
- Interaction to Next Paint (INP): 200 milliseconds or faster at p75
- Cumulative Layout Shift (CLS): 0.1 or lower at p75
Origin vs. URL Level: Which Scope Validates Your Optimization?
Direct answer: Always monitor URL-level CrUX metrics to validate specific page fixes, relying on origin-level metrics only when individual pages lack sufficient traffic to meet Chrome's user privacy thresholds.
Google requires a minimum volume of unique user visits before generating a standalone URL-level CrUX report. When a specific product or blog page hits this threshold, PageSpeed Insights displays both "This URL" and "Origin" tabs.
- URL-Level Data: Isolates the exact template, script payload, and assets for that specific address. Use this to confirm whether compressing an image or refactoring a component solved the problem on that route.
- Origin-Level Data: Aggregates all indexed pages across your domain. If your high-traffic homepage is blazing fast but hundreds of uncached, deep catalog pages are sluggish, origin-level data might mask the slower routes or dilute the impact of an isolated fix.
Diagnosing Regressions and Validating Real-World CWV Gains
Direct answer: Validate genuine performance gains by tracking distribution shifts across "Good," "Needs Improvement," and "Poor" buckets in Google Search Console, cross-referencing your deployment logs to rule out external tracking noise.

When auditing Technical SEO health, a green status in lab tests does not automatically guarantee instant field improvements. To verify that an optimization worked in the field, open the Core Web Vitals report inside Google Search Console.
When you submit a validation request after deploying a fix, Search Console tracks the affected URL group over a continuous 28-day window. If the 75th-percentile field performance stays within the recommended thresholds across that entire span, the issue transitions to "Passed."
Is It a True Regression or Simpson's Paradox? How to Interpret CrUX Trends After a Performance Improvement
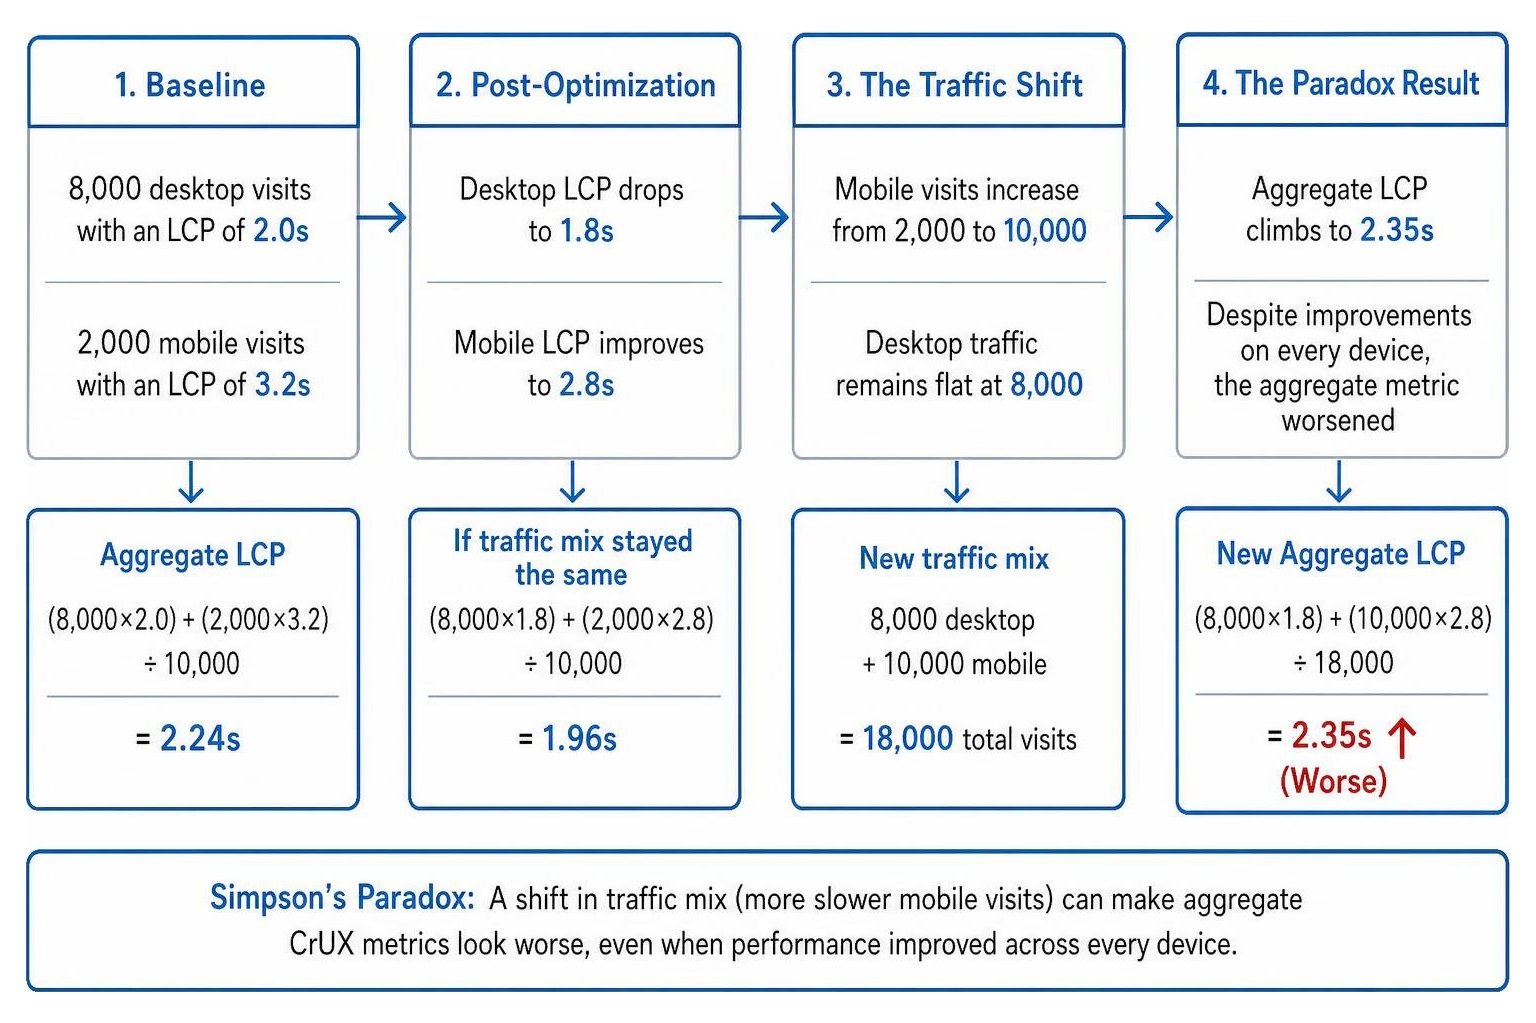
Direct answer: An apparent regression in aggregate CrUX scores is often caused by Simpson's Paradox, a statistical phenomenon where changes in traffic mix (such as a surge in slow mobile visitors) make the overall metric look worse even when speed improved across every individual device type.
Consider a practical example:
- Baseline: A site receives 8,000 desktop visits with an LCP of 2.0 seconds and 2,000 mobile visits with an LCP of 3.2 seconds. The aggregate weighted LCP sits around 2.24 seconds.
- Post-Optimization: You optimize code across the entire site. Desktop LCP drops to a faster 1.8 seconds, and mobile LCP improves to 2.8 seconds.
- The Traffic Shift: Simultaneously, a viral social media campaign or seasonal trend drives mobile visits from 2,000 up to 10,000, while desktop traffic remains flat at 8,000.
- The Paradox Result: The new aggregate LCP climbs to 2.35 seconds. Despite genuine code-level improvements on every device, the aggregate metric worsened simply because slower mobile devices now represent the majority of the traffic mix.
Disaggregating your data by device type and geography is essential before diagnosing a technical regression.
Why Did Specific Metrics Improve While Overall 'Good' Status Stagnated?
Direct answer: Search engines and CrUX summaries apply worst-metric gatekeeping, meaning a URL or URL group is classified by its lowest-performing Core Web Vital; improving LCP from Poor to Good will not elevate the page to "Good" status if INP or CLS remains in the "Needs Improvement" or "Poor" bracket.
In programmatic evaluation libraries like the comparison.rs source logic, performance verdicts evaluate multidimensional deltas. If you slash server response time and optimize hero images, your LCP may jump from 3.8 seconds down to 2.1 seconds (a massive win).
However, if an unoptimized third-party chat widget causes the 75th-percentile Interaction to Next Paint to sit at 280 milliseconds, the page remains flagged as "Needs Improvement." Always check each vital individually rather than relying on high-level bucket status alone.
Step-by-Step Cadence: How to Interpret CrUX Trends After a Performance Improvement Using History APIs
Direct answer: Establish an automated weekly monitoring workflow by connecting the CrUX History API to Google Sheets or Looker Studio, reviewing 40 rolling weekly data points against your deployment log every Tuesday morning.

To maintain long-term technical health as outlined in our Technical SEO Guide, follow this operational cadence:
- Log Deployment Timestamps: Maintain an exact changelog recording when asset optimizations, server updates, or script modifications go live.
- Automate Weekly History Pulls: Use Google Apps Script to query the CrUX History API every Tuesday morning (capturing the Monday 04:00 UTC data refresh). The API returns up to 40 weekly data points spanning six months of rolling 28-day averages.
- Isolate Device Segments: Separate mobile and desktop metrics into dedicated columns to eliminate Simpson's Paradox distortions.
- Track 3-Day and 14-Day Trajectories: At day 3 post-deployment, confirm the metric delta has started shifting in the expected direction. At day 14, look for at least a 50% proportional movement toward your target threshold.
- Confirm Day-30 Resolution: At day 30, evaluate the finalized 75th-percentile metric value against your pre-deployment baseline.
Our team at SmallBizSEO integrates this exact monitoring discipline into our Velocity framework, combining automated data pipelines with clear technical SEO execution to keep web vitals moving in the right direction.
Turning Real-User Speed Data into Long-Term SEO Wins
Interpreting real-user data takes patience, but it provides the only true reflection of how visitors experience your website in the wild. By respecting the 28-day rolling window, tracking the 75th percentile, segmenting by device, and isolating individual vitals, you can cut through dashboard noise and prove the real-world value of your technical work.
If you are ready to eliminate performance bottlenecks and build a resilient search presence, explore our specialized SmallBizSEO CrUX Performance Consulting services to accelerate your site's growth today.