GA4 vs Universal Analytics: Why Your Old Bounce Rate Comparisons Fail

Why GA4 Bounce Rate Does Not Match Your Old Reports
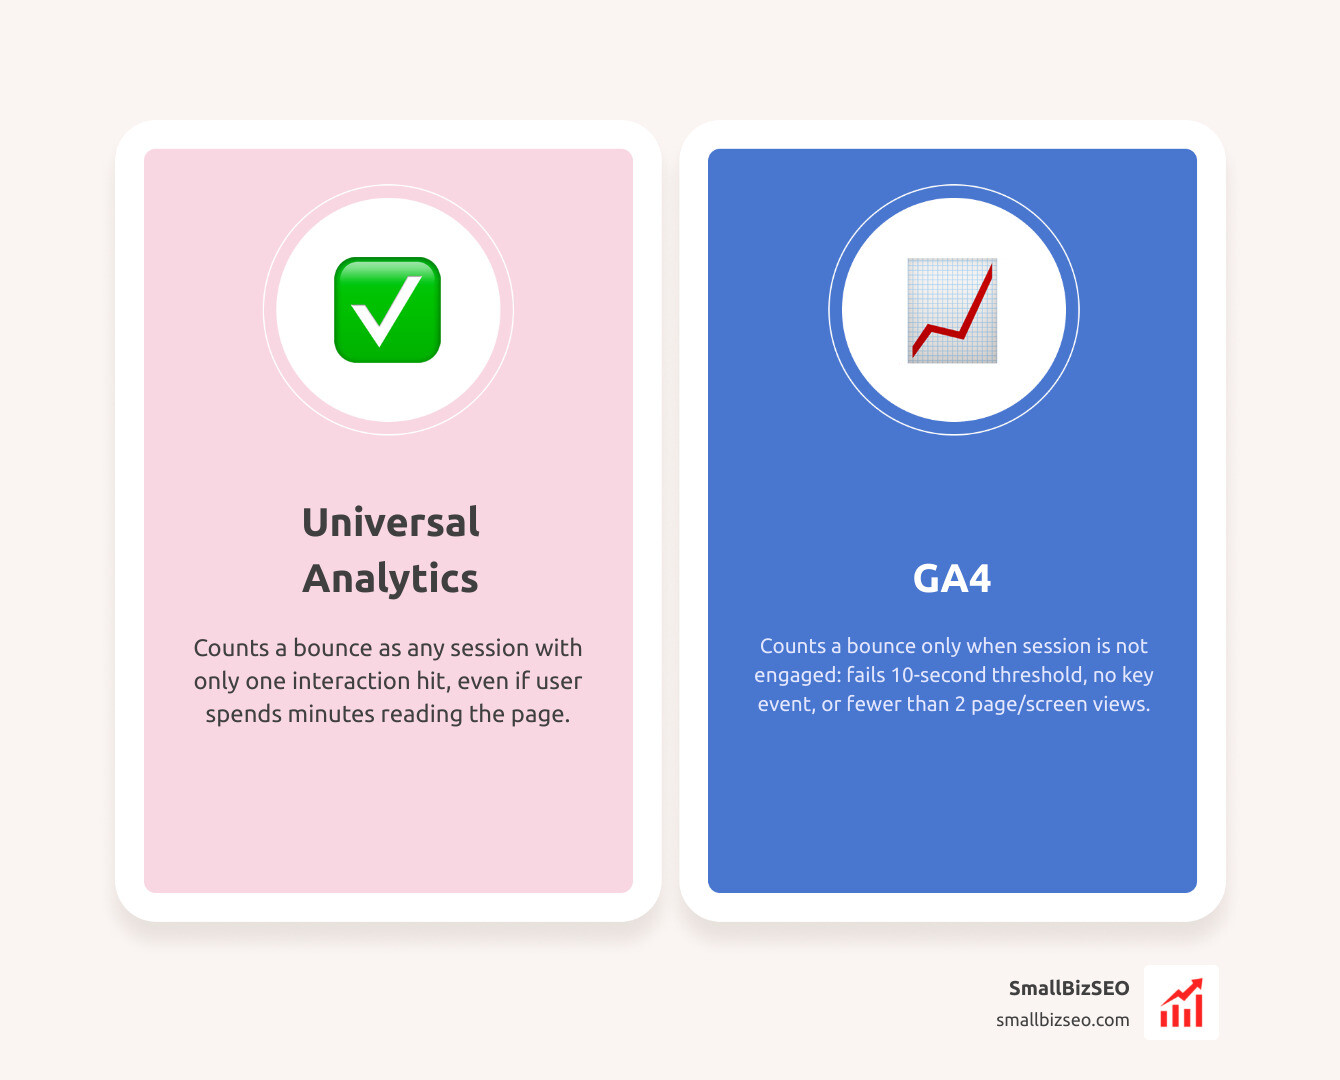
You cannot compare GA4 bounce rate directly with old Universal Analytics reports because the two tools count bounces differently. Universal Analytics counted a session with only one interaction hit as a bounce, even if someone spent minutes reading the page. GA4 counts a session as a bounce only when it is not engaged: it does not pass the default 10-second threshold, include a key event, or reach two page or screen views.
The switch from Universal Analytics' hit-based reporting to GA4's event-based measurement also changes how sessions are recorded. A lower GA4 bounce rate may reflect those new rules, not an improvement to your site. Start a new GA4 baseline instead of carrying over your old target.
I'm Clayton Johnson, founder of SmallBizSEO, where I help small businesses connect SEO work with clear, useful reporting. That focus shapes how I explain why GA4 bounce rate cannot be compared directly with old Universal Analytics reports.
Why Can’t You Compare GA4 Bounce Rate Directly with Old Universal Analytics Reports?
GA4 bounce rate cannot be compared directly to Universal Analytics reports because the underlying data models and calculation rules are entirely different. Universal Analytics (UA) measured sessions using hit types (pageviews, events, transactions), whereas GA4 operates on a flexible, event-based model. When a metric keeps the same name but changes its fundamental math, running a direct comparison creates false performance narratives.
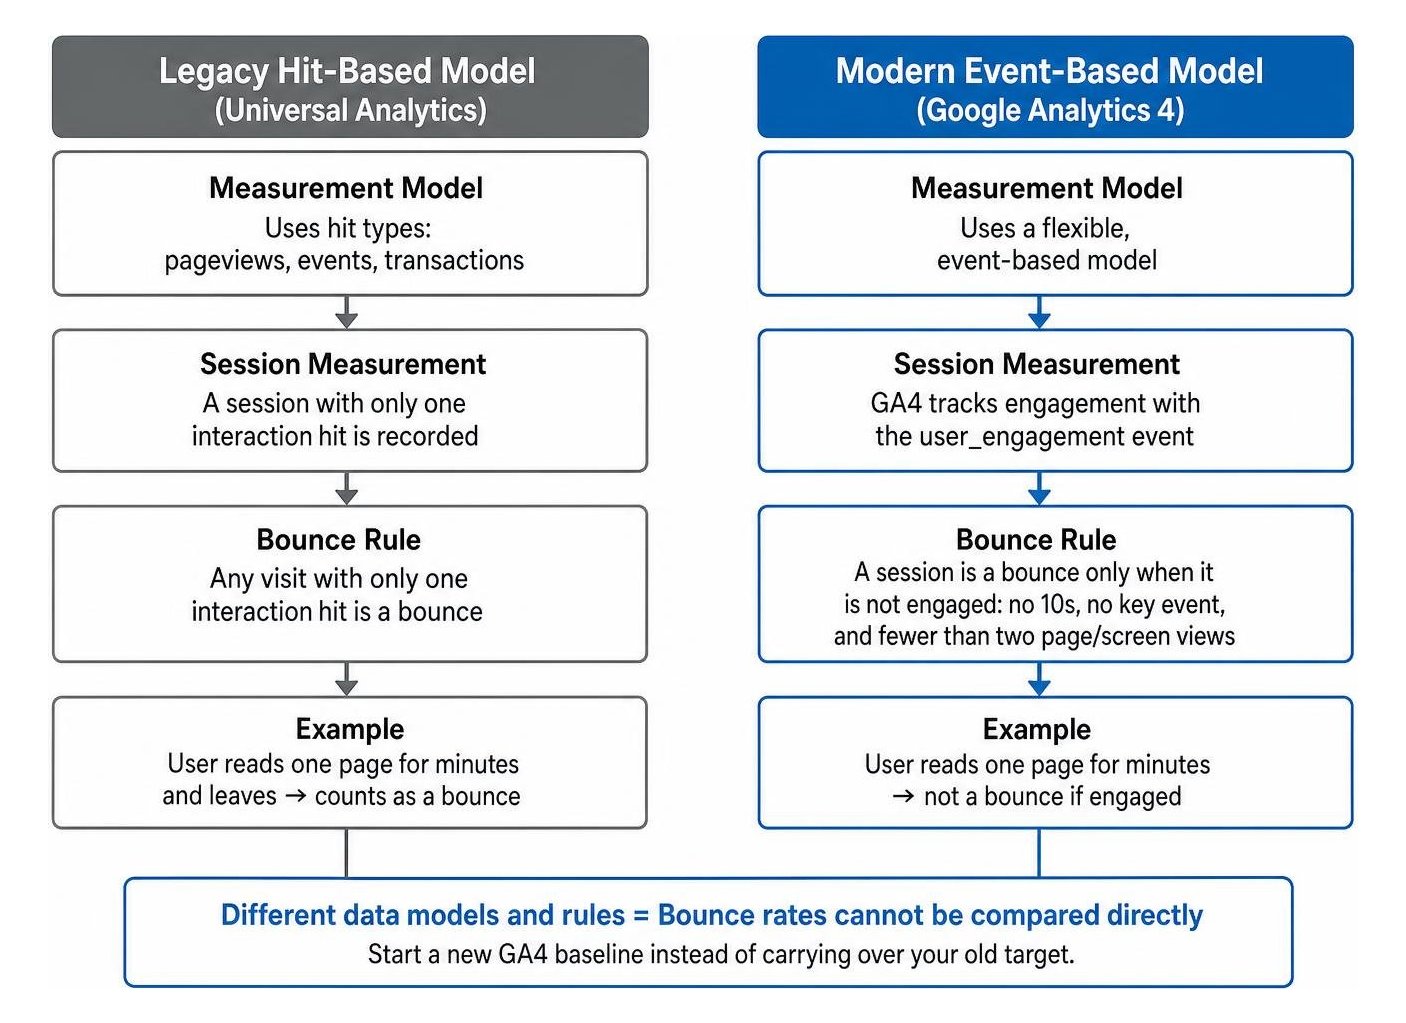
In legacy analytics, any visit that contained only one interaction hit registered as a bounce. If a user arrived on your website, spent ten minutes absorbing a detailed service guide, and left without clicking to a second page, UA recorded that session with a duration of zero seconds and labeled it a bounce. GA4 eliminates this zero-second assumption by continuously tracking active screen time through the user_engagement event.
Trying to track year-over-year trends across both platforms without adjusting your analysis causes serious reporting errors. A legacy bounce rate of 65% alongside a GA4 bounce rate of 32% does not mean your content suddenly doubled in quality overnight. It simply means GA4 measures user behavior with a different lens.
| Metric Attribute | Universal Analytics (UA) | Google Analytics 4 (GA4) |
|---|---|---|
| Core Definition | Percentage of single-page sessions with no secondary interaction hit | Percentage of sessions that were not engaged |
| Duration Factor | Ignored dwell time on single-page visits (logged as 0 seconds) | Counts visits over 10 seconds as engaged |
| Conversion Impact | Did not automatically prevent a bounce unless configured as an interaction hit | Any key event automatically prevents a bounce |
| Reporting Status | Default headline metric | Derived metric (100% minus Engagement Rate) |
How Did Universal Analytics and GA4 Define Bounce Rate Differently?
Universal Analytics defined bounce rate as the percentage of single-interaction sessions. When a visitor landed on a webpage, UA generated a single pageview hit. Unless that visitor navigated to another URL or triggered a specially configured interaction event (like an interactive video play or form submission), UA received no second hit to timestamp the visit.
As outlined in the official [GA4] Engagement rate and bounce rate - Analytics Help documentation, GA4 completely inverts this philosophy. Instead of penalizing a single-page visit, GA4 looks for meaningful interaction signals. In GA4, a bounce occurs only when a session meets none of the engagement criteria. If you want to understand how this shift influences your historical performance analysis, modernizing how you view your legacy bounce rate is the first step toward clear reporting.
How Do Engaged Sessions and the 10-Second Threshold Change the Measurement?
GA4 measures interaction through the concept of an engaged session. A session is officially classified as engaged if it satisfies at least one of these three criteria:
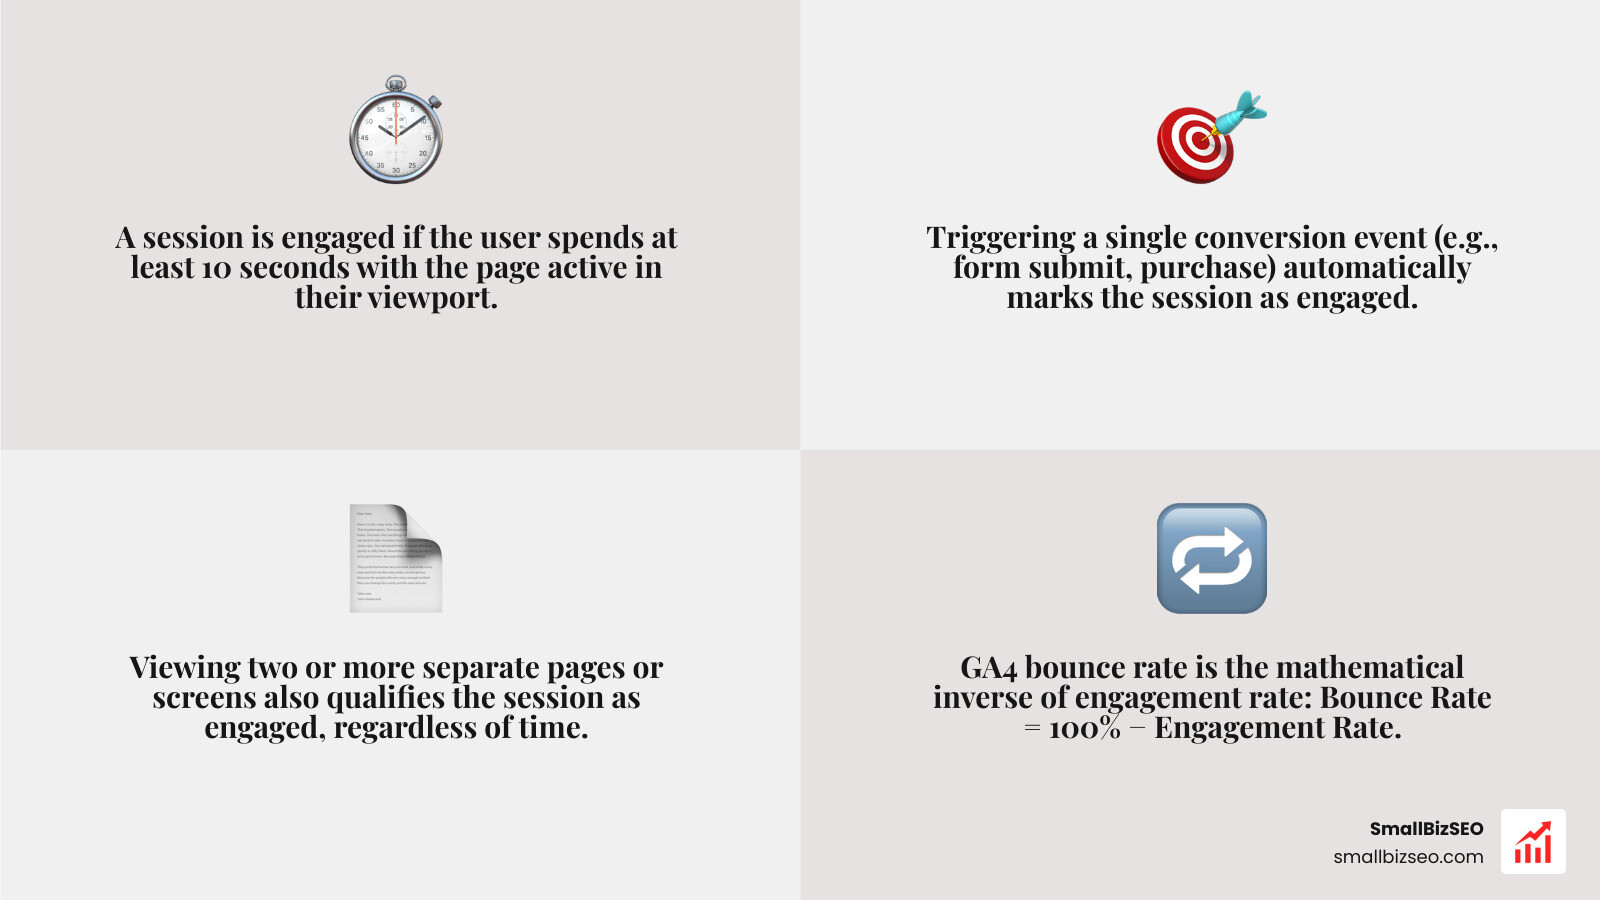
- The visitor spends at least 10 seconds with the webpage active in their browser viewport.
- The visitor triggers one or more key conversion events.
- The visitor views two or more separate pages or screen views.
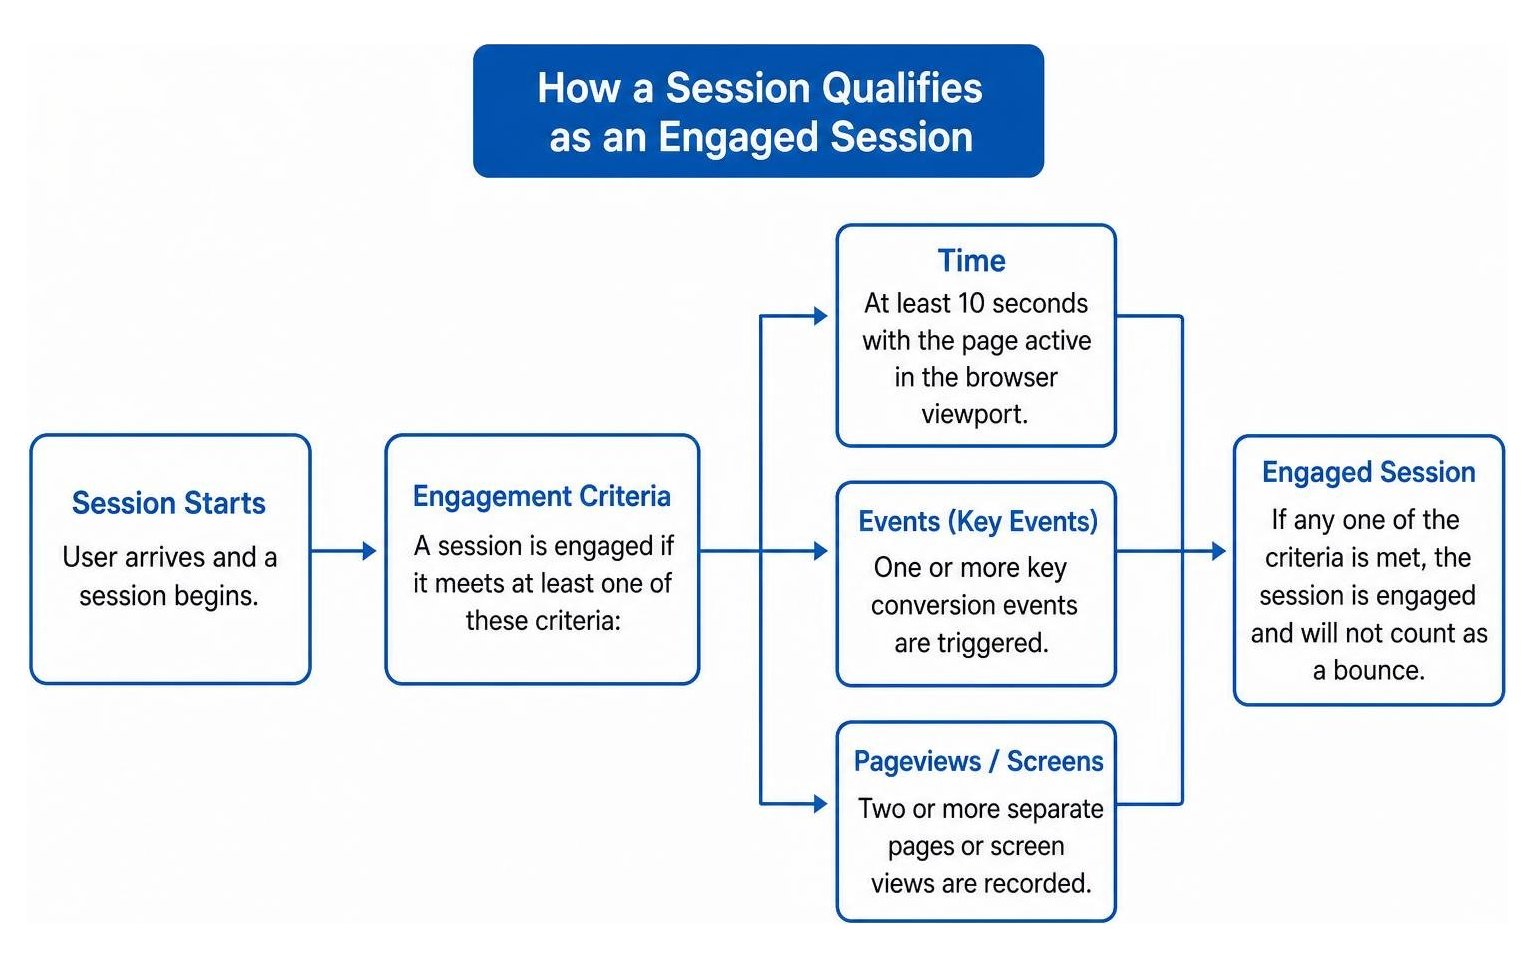
This 10-second active dwell threshold rescues a massive volume of visits that UA previously wrote off as lost traffic. If a user lands on a blog post, reads the primary solution for 15 seconds, and closes the tab, GA4 records that as an engaged session. The session is counted as positive interaction, meaning it will not appear in your bounce count.
How Does the Math Change, and How Can You Build a Reliable Comparison?
In GA4, bounce rate is not an independently calculated raw metric. It is simply the exact mathematical inverse of your engagement rate:
Bounce Rate = 100% − Engagement Rate
For example, if your website registers 1,000 total sessions and 650 of them qualify as engaged, your engagement rate is 65%. Consequently, your GA4 bounce rate is 35%.
Because of this formula, comparing GA4 bounce rates against UA reports gives an illusion of sudden improvement. To maintain data integrity across your business reviews, you must archive your old numbers and establish a clean reporting baseline built entirely inside GA4.
How Does the Change Affect Content Sites, Ecommerce, and Landing Pages?
The shift from single-page tracking to engaged sessions produces distinct patterns across different business models:
- Content Websites and Blogs: Under UA, informational blogs frequently showed bounce rates between 70% and 90% because visitors arrived via search, read the article, and exited. In GA4, because readers take time to consume the text, blog bounce rates often settle between 35% and 50%.
- Ecommerce Stores: Product detail pages often see modest changes. Shoppers naturally click to related items, add products to carts, or browse category collections. When visitors trigger shopping events, those sessions automatically become engaged.
- Paid Landing Pages: Single-page lead generation pages with short forms previously looked like failures in UA if the form submission was not configured as an interaction hit. In GA4, any visit that leads to a form submission or lasts past the engagement timer is marked engaged.
- Mobile vs. Desktop Behavior: Mobile visitors browse quickly and exit frequently. Mobile bounce rates across industries remain roughly 8 to 12 percentage points higher than desktop rates, making device segmentation essential when evaluating page performance.
How Can You Transition Your Analytics and Avoid Common Reporting Mistakes?
To transition your analytics smoothly, establish a new GA4 performance baseline, educate your team on the revised definitions, and monitor engagement rate as your primary quality metric. The most frequent mistake teams make is trying to optimize the metric itself—such as firing artificial events to manipulate bounce figures—rather than improving the user experience.
When presenting analytics to leadership or clients, use these practical steps to maintain reporting clarity:
- Switch to Engagement Rate: Present engagement rate first. Framing performance around active engagement delivers a constructive view of user intent.
- Isolate Landing Page Diagnostics: Use bounce rate only as a diagnostic metric to spot technical errors, broken scripts, or severe traffic-to-content mismatches.
- Centralize Your Dashboards: Build cross-channel reporting by connecting your data directly into Looker Studio to present uniform charts that prevent metric confusion.
- Verify Tag Health: Review your tag setup to make sure events fire accurately without false duplicates.
At SmallBizSEO, our data-driven "Velocity" framework delivers fast organic visibility and E-E-A-T-compliant growth through transparent, automated reporting. If you need clarity on your site metrics, our specialized SEO audit services help you separate reporting artifacts from true business growth.
How Can You Customize GA4 Reports and Adjust the Engagement Timer?
GA4 does not display bounce rate in most standard reporting tables by default, but you can easily add it to your views or adjust how engaged sessions are counted:
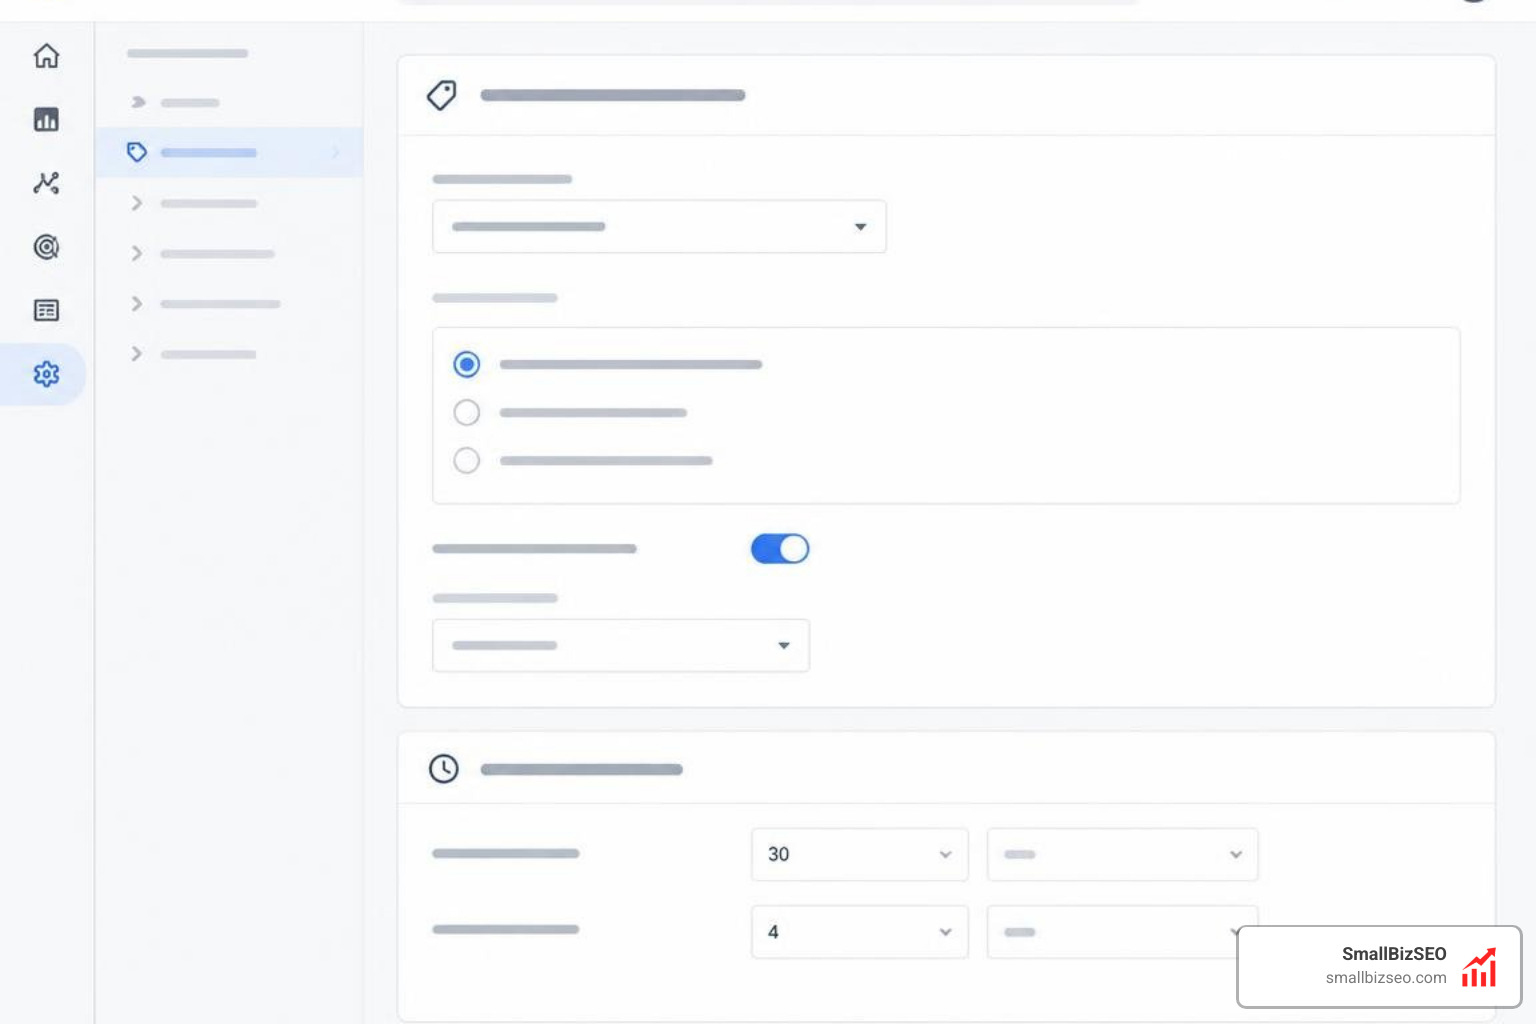
- Adjusting the Engagement Timer: In your GA4 Admin panel, navigate to Data Streams, select your web stream, click Configure tag settings, select Show all, and open Adjust timer for engaged sessions. You can adjust the default threshold from 10 seconds up to a maximum of 60 seconds. Raising this threshold is helpful for websites with long-form technical content where 10 seconds does not represent true consumption.
- Adding Bounce Rate to Standard Reports: Navigate to any detail report (such as the Landing Page report), click the Customize report pencil icon in the top right, select Metrics, click Add Metric, select Bounce rate, and click Apply to save your customized view.
Building customized views ensures your team works from a clean SEO reporting dashboard configured specifically for your business goals.
Moving Beyond Legacy Analytics Benchmarks
Treating GA4 as a direct replacement for Universal Analytics prevents you from seeing the true value of your traffic. Universal Analytics punished single-page visits regardless of how helpful the content was. GA4 provides a more realistic view of visitor behavior by measuring active screen time, meaningful event completions, and multi-page journeys.
Stop comparing current numbers against outdated historical sheets. Establish your new baselines, customize your engagement thresholds to fit your content strategy, and evaluate performance using metrics designed for modern web user journeys.