Why Your Top Performing Channel Might Not Actually Cause Conversions

How can you compare channel credit without confusing it with causation?
For comparing channel credit without mistaking attribution for causation, use attribution to see which channels get credit for a sale. Then use a holdout test to check whether sales change when a channel's ads are withheld. Compare both results with actual revenue and customer value before moving your budget.
This matters because a branded search ad or retargeting ad may be the last click before a purchase, even when the customer already planned to buy. Last-touch credit shows where the tracked journey ended, not what caused the sale.
I'm Clayton Johnson, founder of SmallBizSEO, where I help small businesses connect SEO and content to qualified leads. My approach to comparing channel credit without mistaking attribution for causation starts with a simple question: did the channel help create a business result, or did it just get credit for one?
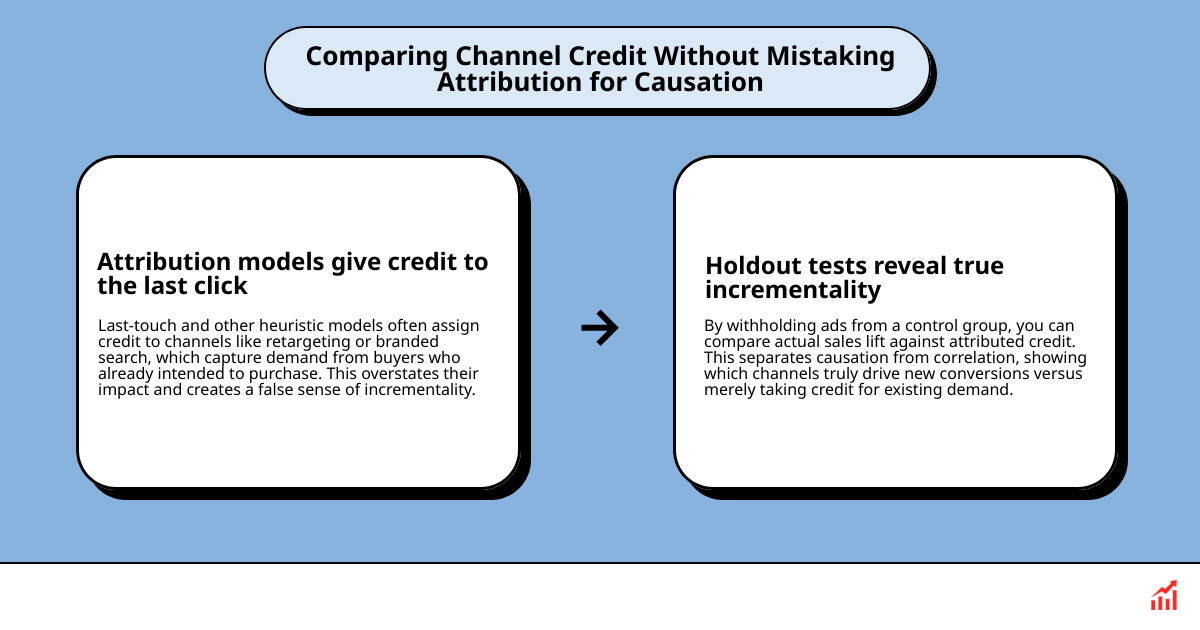
Comparing Channel Credit Without Mistaking Attribution for Causation: Why Top Channels Lie
When you open your analytics dashboard, your highest-converting channels often look like undisputed champions. Retargeting display ads boast high returns, and paid branded search seems to deliver customers for pennies. But there is a hidden catch: these channels frequently claim credit for buyers who had already decided to buy.

Attribution measures correlation—the chronological observation that a customer interacted with an ad before completing a purchase. Causation measures incrementality—the lift in revenue that occurred strictly because the marketing occurred, which would have vanished in the absence of that marketing.
Last-touch attribution is like giving all the credit to the person who opened the refrigerator door, ignoring the person who baked the cake. When we confuse touchpoint correlation with true causation, we overfund bottom-funnel harvesting channels and starve the top-of-funnel channels that drive genuine business growth.
| Measurement Approach | What It Measures | Core Bias / Limitation | Best Decision Use Case |
|---|---|---|---|
| Last-Touch Attribution | The final recorded touchpoint prior to conversion | Severely overvalues bottom-funnel harvesting (retargeting, brand search) | Daily bid and creative adjustments |
| First-Touch Attribution | The initial recorded touchpoint | Ignores mid-funnel nurture and closing channels | Initial discovery channel analysis |
| Linear Attribution | Distributes credit evenly across all recorded clicks | Treats every touchpoint as equally influential | General baseline journey mapping |
| Incrementality Testing | The causal difference between treatment and control groups | Requires controlled testing and pause periods | Strategic budget allocation and validation |
Why is your last-touch attribution model confusing correlation with true incrementality?
Last-touch attribution models confuse correlation with incrementality because they measure demand capture rather than demand creation. When a consumer searches for your exact brand name, they are navigating to your store, not discovering your value proposition.
When you rely solely on an over-credited attribution model, you fall victim to the classic "140% ROAS problem." If you sum up the conversions self-reported across Google Ads, Meta Ads, and your email platform, you will frequently find they claim credit for 140% of the actual revenue that landed in your bank account.
For instance, branded search typically demonstrates only 20% to 40% incrementality, meaning 60% to 80% of those buyers would have clicked your organic search listing anyway. Similarly, in a typical retargeting campaign, 180 out of 200 attributed conversions would have happened anyway, meaning the true incremental effect is only 20 conversions—a 90% difference in perceived impact.
How does selection bias distort channel performance when comparing channel credit without mistaking attribution for causation?
Selection bias distorts channel performance by intentionally targeting people who already possess high intent to buy. Ad networks optimize their algorithms to show ads to users most likely to convert in order to claim credit, not to users who need persuasion.
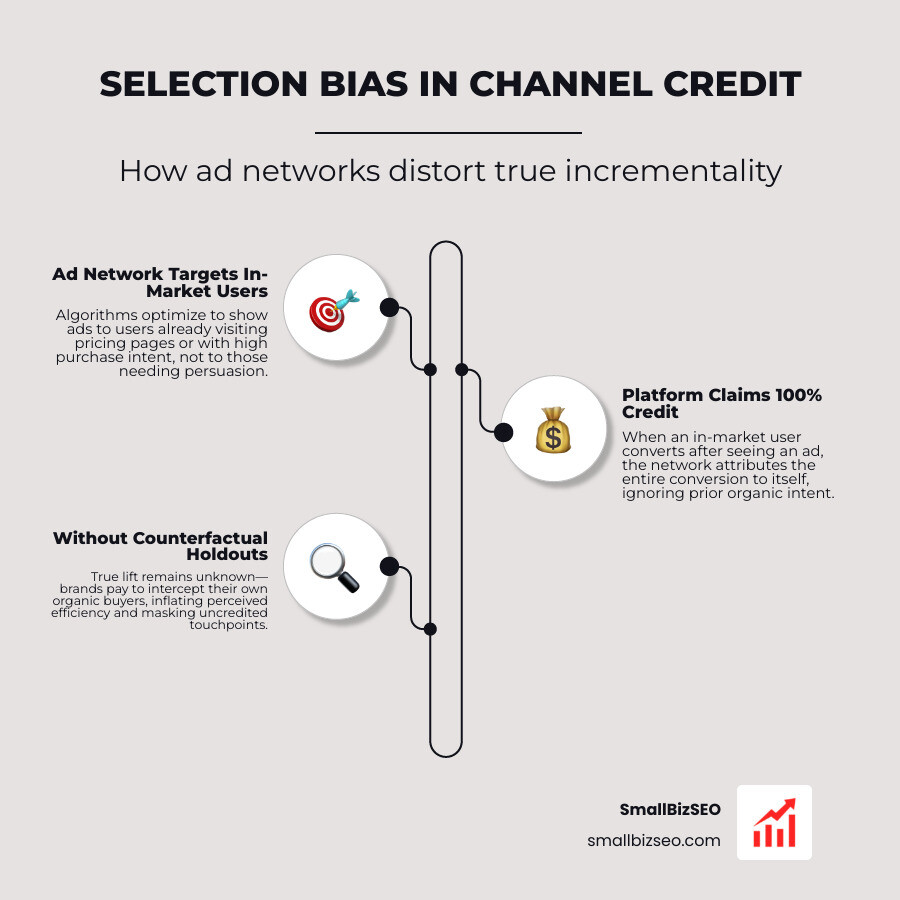
When an ad platform targets an in-market user who is already visiting your pricing page, the platform claims 100% of the credit for that conversion. However, without establishing a counterfactual—measuring what happens to a matched holdout group that receives no ads—you cannot isolate true lift.
Relying on self-attribution networks creates an illusion of high efficiency while masking millions of uncredited touchpoints. Research on triangulated marketing measurement demonstrates that without causal holdouts, brands end up paying high fees to intercept their own organic buyers.
What warning signs show your conversion rate and touchpoint data are skewed?
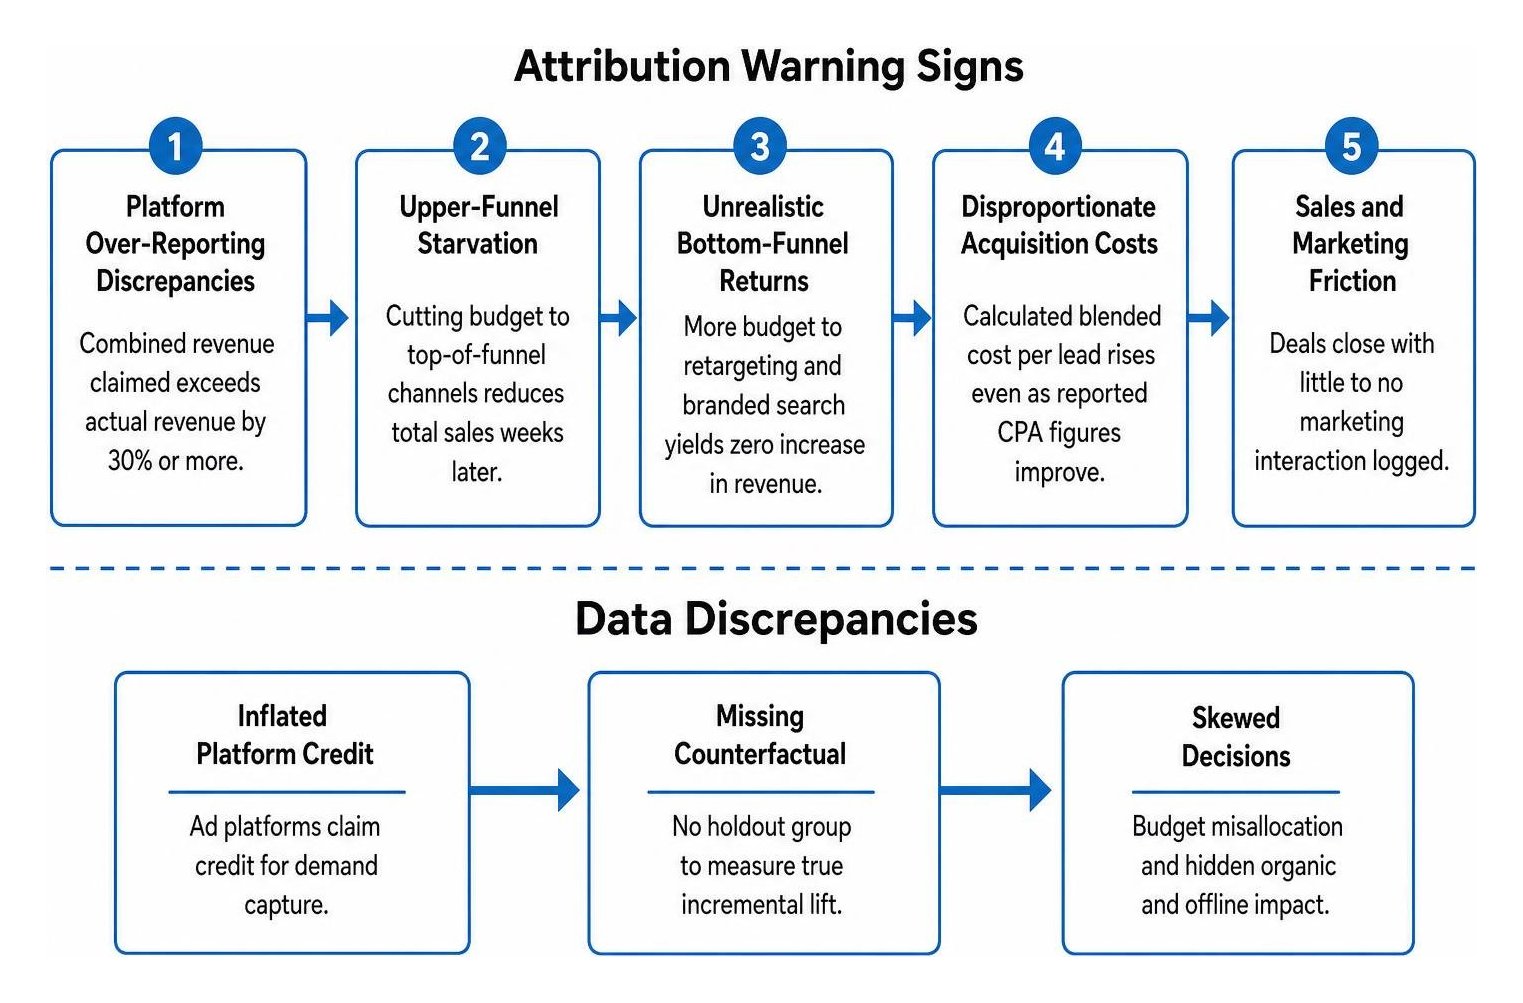
When your data is skewed by attribution bias, your reporting exhibits clear systemic disconnects between marketing metrics and bank deposits. Watch for these common warning signs:
- Platform Over-Reporting Discrepancies: The combined revenue claimed by individual ad platforms exceeds your actual total backend revenue by 30% or more.
- Upper-Funnel Starvation: Cutting budget to educational content, SEO, or top-of-funnel social instantly reduces total sales weeks later, despite those channels showing a low in-platform conversion rate.
- Unrealistic Bottom-Funnel Returns: Retargeting and branded search report astronomical returns, yet increasing their budget yields zero increase in total company revenue.
- Disproportionate Acquisition Costs: Your calculated blended cost per lead rises continuously even as reported platform cost-per-acquisition figures appear to improve.
- Sales and Marketing Friction: The sales team reports deals closing with little to no marketing interaction logged, hiding offline influence and organic dark social interactions.
How to Triangulate Attribution, Incrementality, and Marketing Mix Modeling
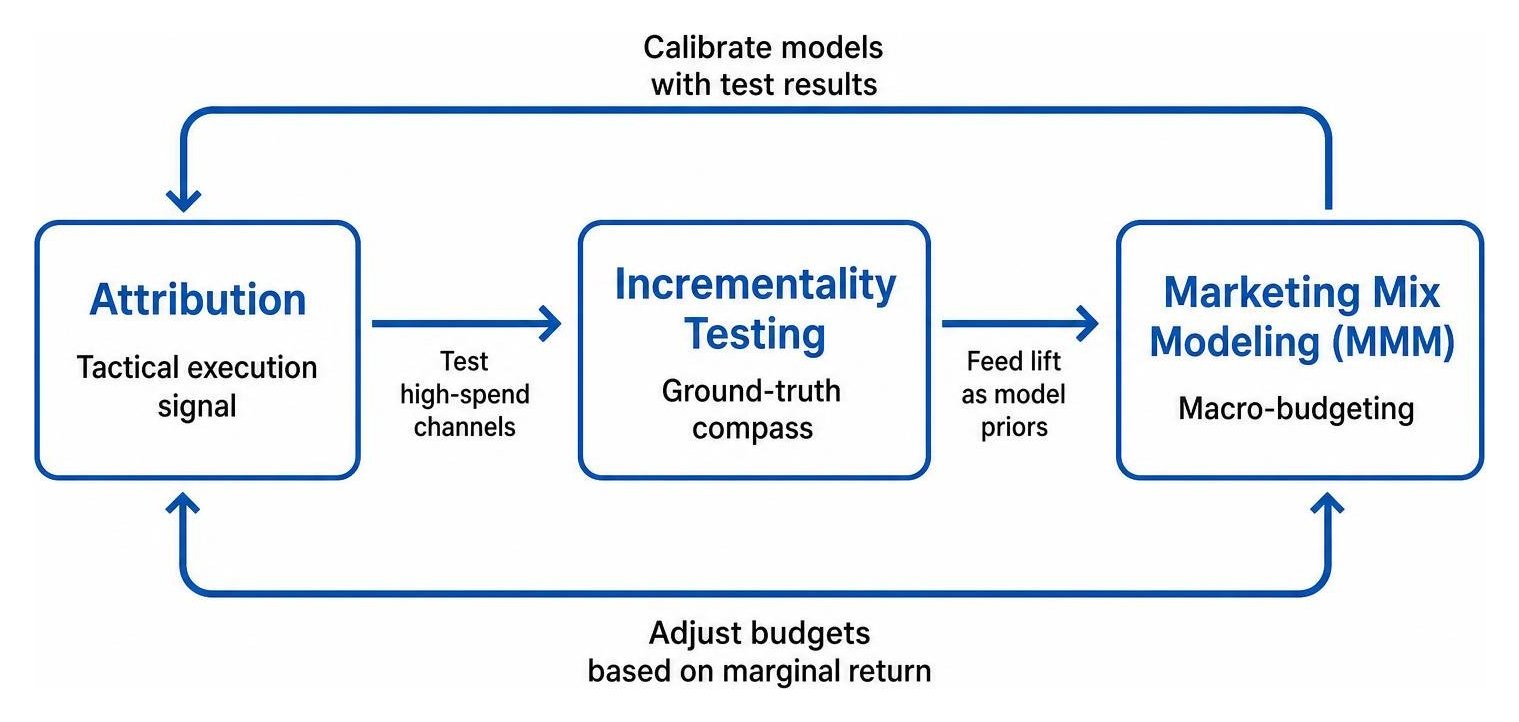
To prevent budget misallocation, modern marketing teams use a triangulated measurement framework. Rather than searching for a single "perfect" dashboard, triangulation combines three distinct layers: multi-touch attribution for daily tactics, incrementality experiments for causal validation, and marketing mix modeling (MMM) for macro-budgeting.

Attribution acts as your tactical execution signal, tracking path interactions for fast creative optimization. Incrementality testing acts as the ground-truth compass, running controlled experiments to calculate true incremental return on ad spend. Marketing mix modeling uses aggregate time-series regression to account for external factors, offline channels, and channel interactions.
Enterprise brands that adopt triangulated incremental measurement typically see 10% to 25% efficiency gains through causally validated reallocation without increasing their overall spend. As highlighted in analysis of media mix incrementality, calibrating your models against causal tests ensures that top-of-funnel growth engines are never prematurely turned off.
What role do geo-holdout tests play in comparing channel credit without mistaking attribution for causation?
Geo-holdout tests isolate true causal impact by splitting geographic regions into matched treatment and control groups. In the treatment markets, advertising spend runs normally or scales up; in the control markets, spend is paused or significantly reduced.
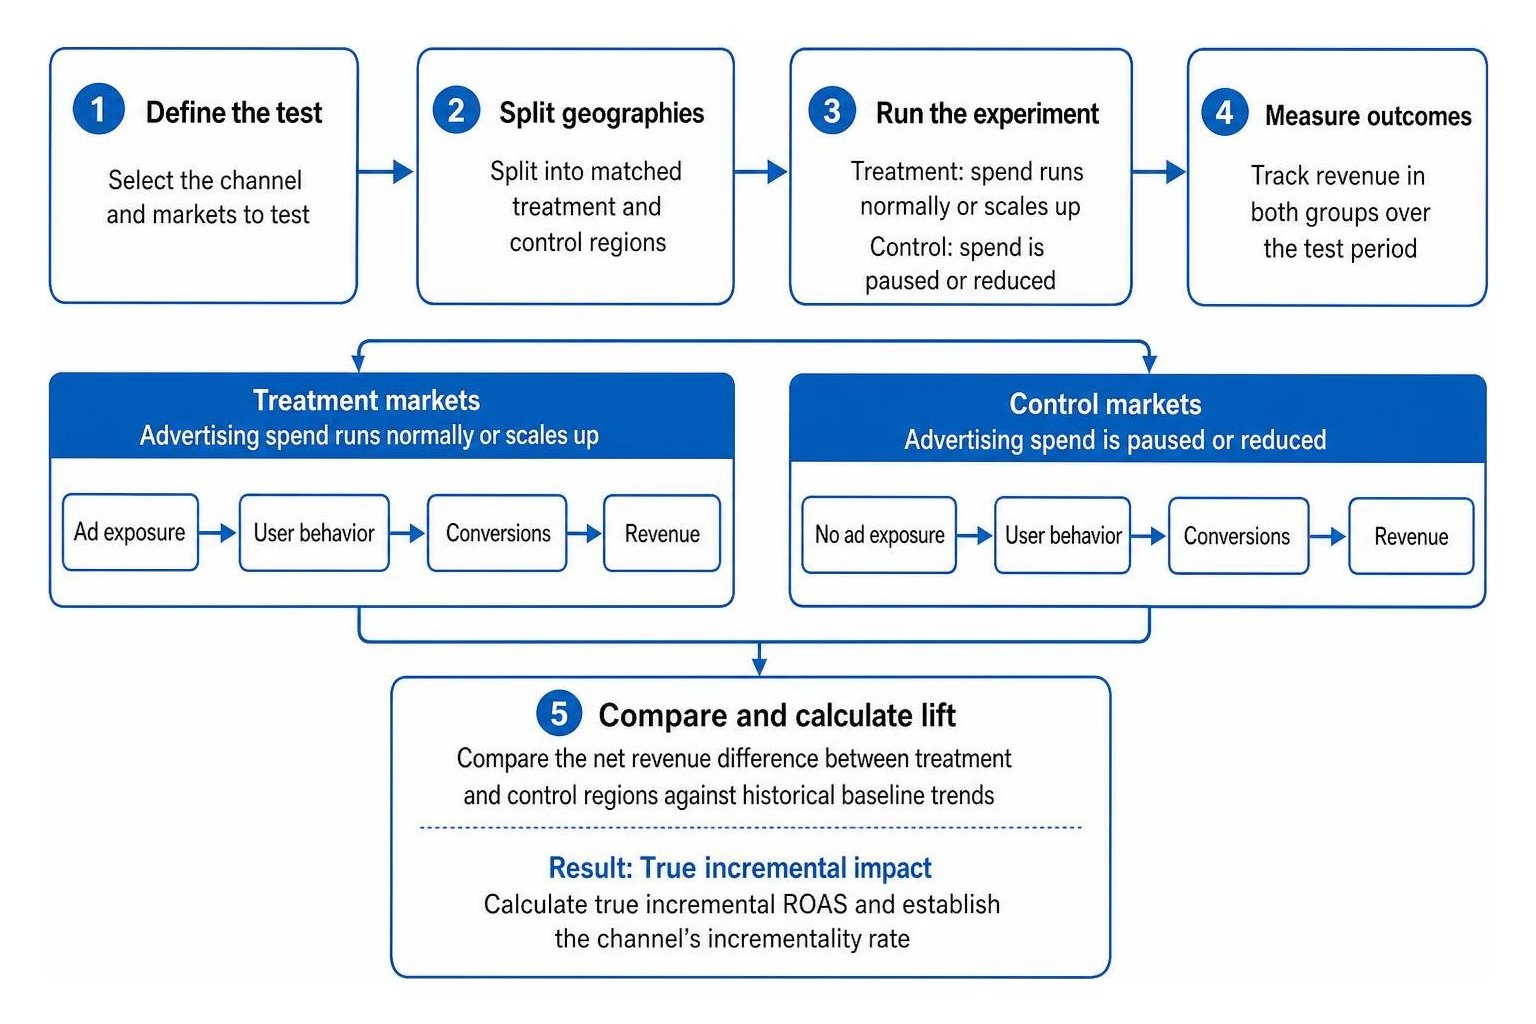
By comparing the net revenue difference between the treatment and control regions against historical baseline trends, you establish a clear counterfactual. Geo-holdout tests provide the statistical power required to calculate true incremental ROAS and establish a channel's incrementality rate.
These randomized experiments eliminate cookie tracking gaps and privacy blockers. They give you the empirical proof needed to determine whether cutting spend in a channel hurts overall revenue or simply trims non-incremental ad waste.
How should teams evaluate downstream metrics like SEO ROI and customer lifetime value?
Evaluating channel performance solely on immediate last-touch conversion ignores how customer acquisition quality influences long-term profitability. Channels that create initial demand often bring in higher-intent customers who retain longer, upgrade more frequently, and generate higher lifetime value.
When assessing your long-term SEO ROI, look at cohort retention and customer lifetime value across 6, 12, and 24 months. Organic search content often educates buyers thoroughly during their discovery process. In complex enterprise sales journeys—which now average 266 touchpoints across buying groups of 5 to 11 stakeholders—early content touches build the trust required to drive durable revenue that simple retargeting ads cannot replicate.
How can you build a closed-loop measurement framework for smart budget allocation?
Building a closed-loop measurement framework ensures that daily tactical adjustments align with causally proven financial outcomes. This framework operates as a continuous learning cycle rather than a static reporting dashboard.
- Deploy Layered Tracking: Implement consistent event taxonomy, server-side tracking, and baseline multi-touch models to observe user paths across all touchpoints.
- Execute Causal Lift Experiments: Run quarterly geo-holdout or spend-down tests on high-spend channels to identify baseline incrementality rates.
- Calibrate Models with Test Priors: Feed empirical lift results back into your marketing mix models as Bayesian priors to adjust historical contribution curves.
- Reallocate Based on Marginal Return: Shift budget toward channels with the highest causally proven marginal returns rather than relying on average reported performance.
- Review Operating Cadence: Evaluate tactical attribution data weekly for ad creative optimization, review incrementality tests quarterly, and adjust macro-allocations annually.
At SmallBizSEO, we help businesses implement data-driven attribution model strategies and organic search systems that focus on verifiable pipeline growth. Even reallocating 5% to 10% of your marketing budget based on test-calibrated causal insights can unlock a 5% to 15% incremental revenue lift in the first quarter.
Moving from Attributed Credit to Causal Growth
Marketing analytics should clarify where your money produces real growth, not provide vanity metrics that make every ad platform look profitable. When you stop mistaking correlation for causation, you stop paying for customers who were already standing in line to buy.
By balancing tactical attribution tracking with randomized incrementality testing and top-down media modeling, you build a resilient, privacy-safe measurement engine. Use attribution to guide your day-to-day creative decisions, run holdout tests to validate true business lift, and invest your marketing dollars where they genuinely generate new revenue.