A Practical Field Guide to Share of Voice Benchmarks and Calculation

What Is a Useful Share of Voice Benchmark for a Small Business?
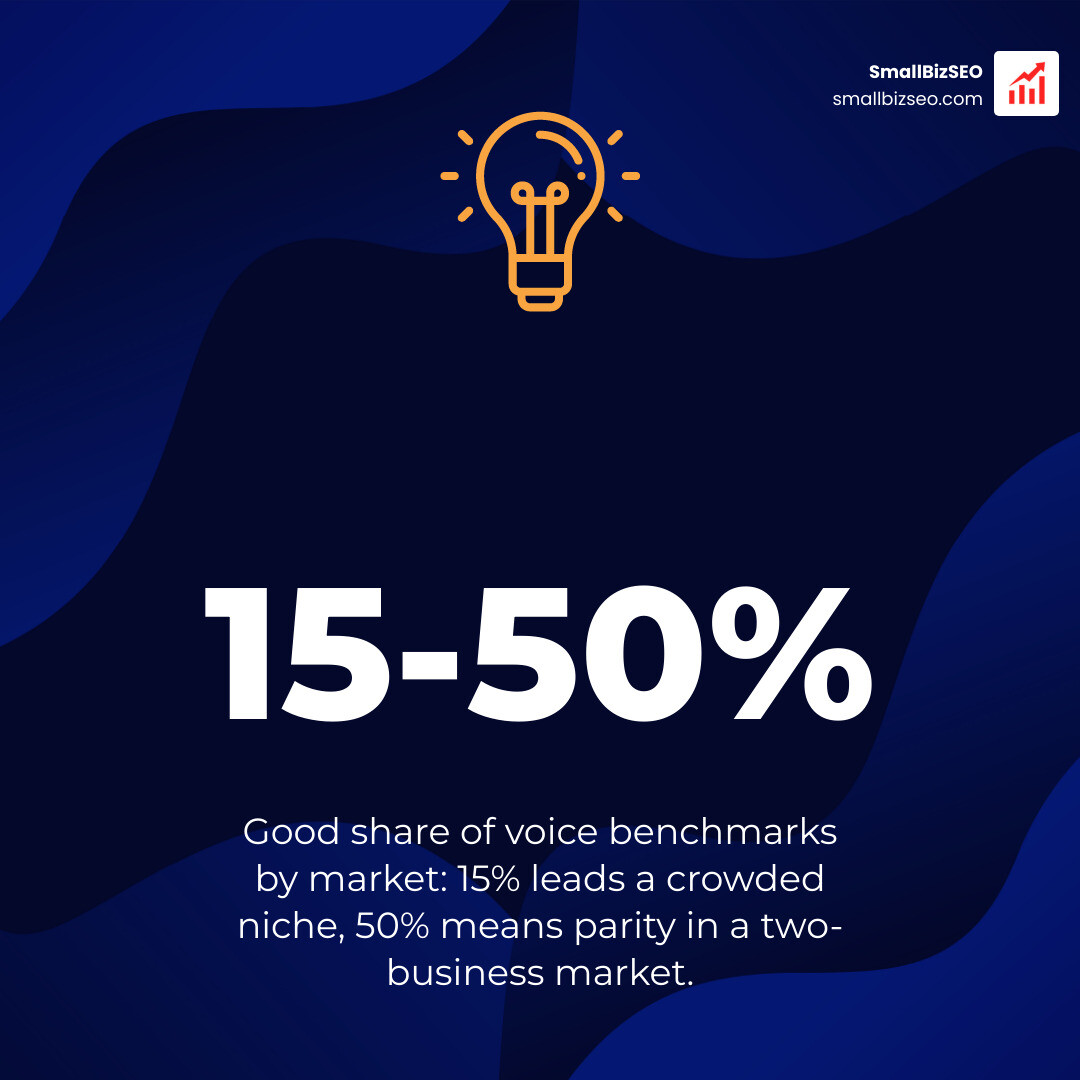
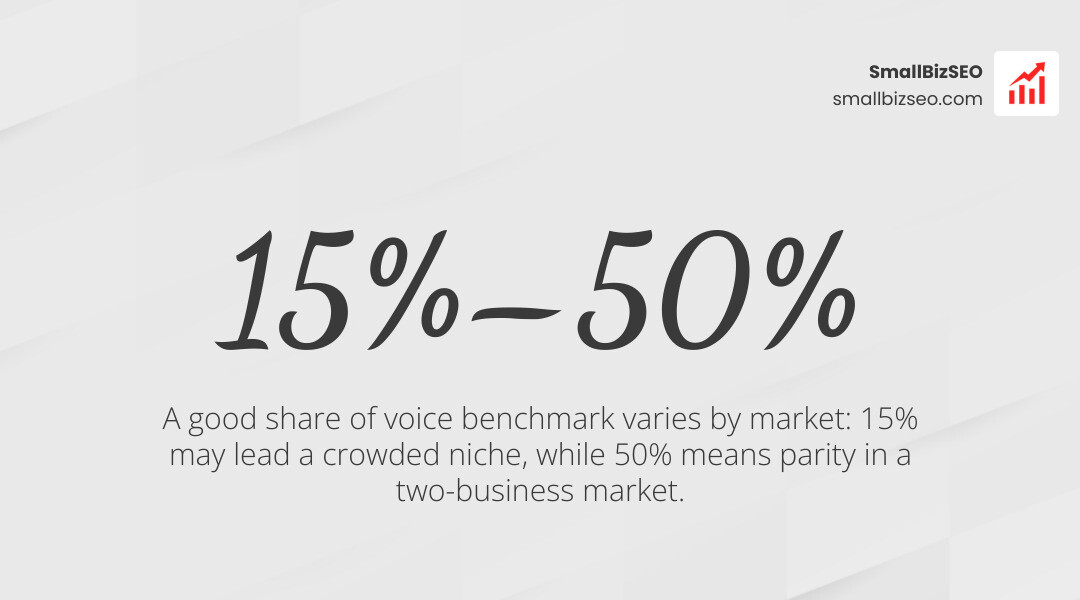
A share of voice benchmark shows how much visibility your business has compared with competitors in a defined market. To set one, choose a small group of direct competitors, pick the searches or conversations that matter to customers, and measure everyone over the same period. Divide your visibility by the total visibility in that group, then multiply by 100. A good result depends on the market: 15% may lead a crowded niche, while 50% means parity in a two-business market.
Measure each channel separately. Social and media benchmarks often count mentions; SEO tracks visibility for relevant searches; paid search tracks eligible ad impressions; and AI search tracks mentions, recommendations, and citations. The goal is to find where customers can see competitors but not you, then track whether that gap closes.
I’m Clayton Johnson, founder of SmallBizSEO, where I connect SEO, content, and digital PR to help small businesses build visibility and attract qualified leads. I use a share of voice benchmark to turn that work into a practical question: where does a business need to become easier to find and trust?
Key share of voice benchmark vocabulary:
What Is Share of Voice and How Is It Measured Across Channels?
Share of voice (SOV) measures the percentage of total market conversation, search real estate, or media exposure your brand owns compared to direct competitors. Originally created for broadcast advertising, SOV now serves as a dynamic cross-channel metric covering organic search, paid advertising, social discussions, digital PR, and conversational AI answers.

Modern discovery happens across fragmented touchpoints. In organic search, zero-click searches capture over 50% of Google queries, meaning users frequently get their answers without clicking through to a website. At the same time, the first page of search results captures approximately 92% of organic clicks, while page two receives only 6%. Understanding brand presence requires looking beyond raw traffic numbers to evaluate total mental availability and category prominence. As outlined in Search Engine Land's guide to share of voice, tracking competitive presence reveals exactly which players dominate customer attention.
To evaluate your baseline position effectively, review our practical guide to brand visibility metrics to see how multi-channel tracking connects to buyer perception.
What Is the Formula for Calculating SOV in Organic and Paid Search?
The universal baseline formula for calculating share of voice is:
Share of Voice % = (Your Brand Metrics ÷ Total Market Metrics) × 100
In paid search (PPC), ad networks provide this directly via Impression Share. Impression share measures the percentage of impressions your ads receive relative to the total auctions your ads were eligible to win. Reviewing your lost impression share due to budget constraints versus lost impression share due to ad rank reveals whether you need more ad spend or higher Quality Scores to expand coverage.
In organic search (SEO), SOV measures non-branded keyword dominance before the click occurs. To calculate weighted organic search SOV across a keyword cluster (typically 100 to 300 commercial queries):
- Determine the monthly search volume for each target keyword.
- Record the ranking position for your site and each competitor.
- Multiply the search volume by the estimated click-through rate (CTR) curve for each position (typically ~30% for position 1, ~15% for position 2, scaling down through the top 10).
- Sum your estimated organic traffic across the entire keyword set.
- Divide your total estimated traffic by the total search volume of the keyword cluster and multiply by 100.
Learn actionable steps for improving search engine visibility across competitive search queries without unnecessary complexity.
Why Does AI Search Demand a New Visibility Framework?
Generative AI platforms synthesize zero-click answers directly inside conversational interfaces, fundamentally changing digital visibility. 73% of B2B buyers use conversational AI tools during purchase evaluations. When an AI summary appears in search results, the traditional organic result CTR drops from 15% to 8%, and the top-ranking organic page experiences an average 58% lower click-through rate.
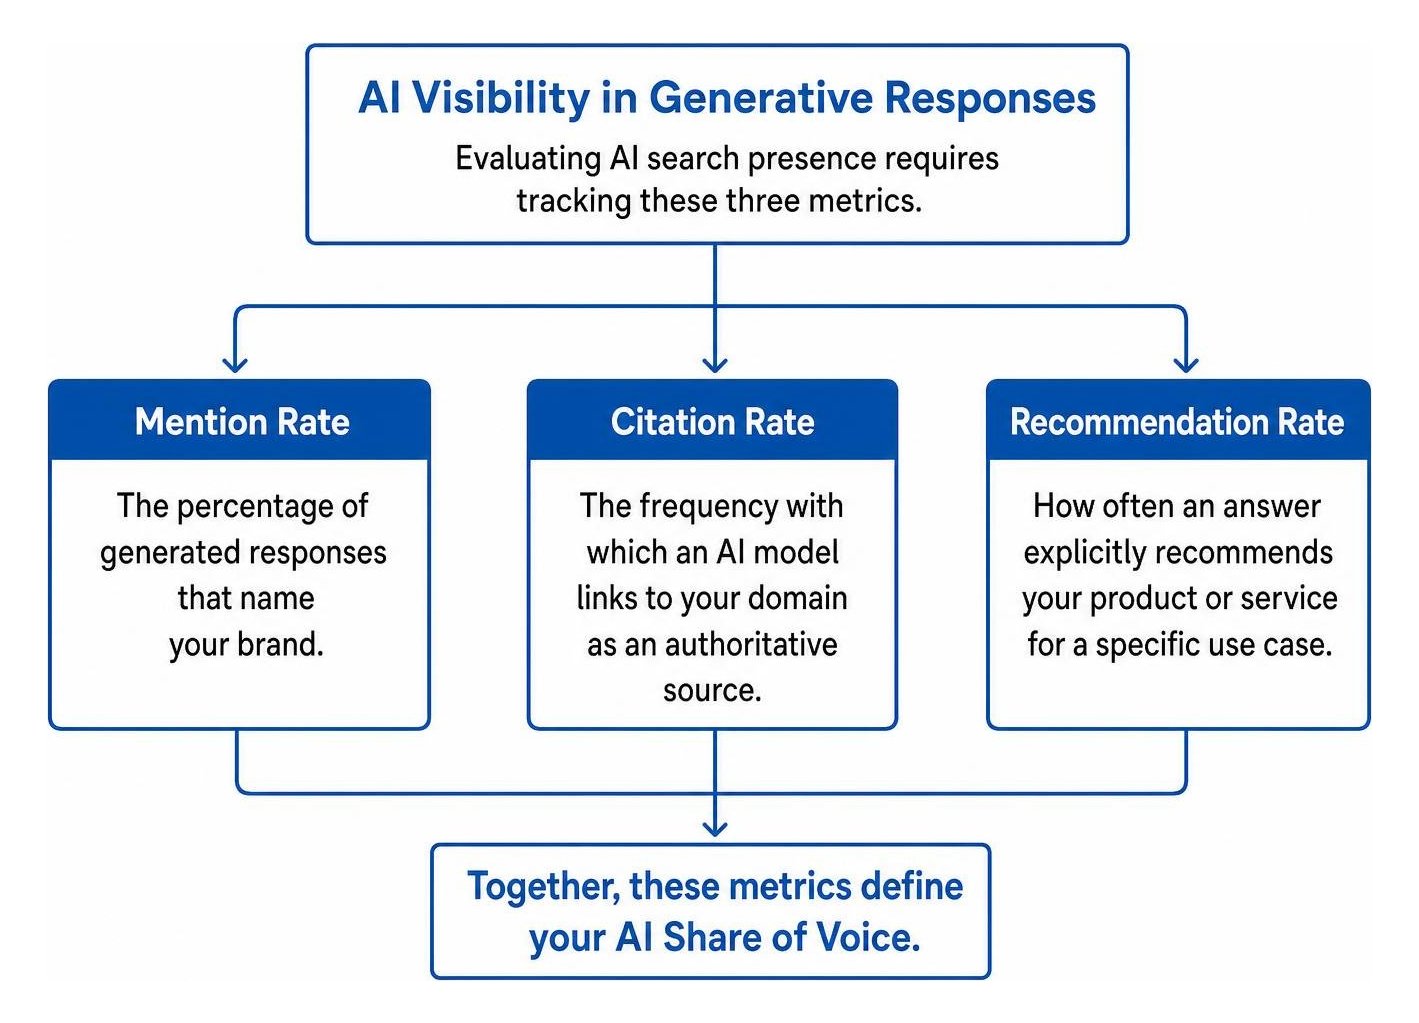
Evaluating AI search presence requires tracking five specific metrics:
- Mention Rate: The percentage of generated responses that name your brand.
- Citation Rate: The frequency with which an AI model links to your domain as an authoritative source.
- Recommendation Rate: How often an answer explicitly recommends your product or service for a specific use case.
- Citation Absorption: Whether your cited content directly shapes the synthesized answer or is merely listed in footnote references.
- Brand Sentiment: The contextual tone (positive, neutral, or negative) surrounding your brand mentions.
How to Establish a Realistic Share of Voice Benchmark for Your Market
A realistic share of voice benchmark is determined by market fragmentation, competitive density, and your stage of business growth. In a crowded niche with dozens of active competitors, a modest share of voice represents market leadership, whereas that same figure in an oligopoly signals an urgent visibility crisis.
As detailed in Brandwatch's guide on brand visibility calculation, setting appropriate baselines prevents teams from chasing unrealistic metrics while ignoring true competitive gains.
| Business Stage & Market Structure | Competitor Count | Target SOV Benchmark Range | Primary Strategic Objective |
|---|---|---|---|
| Niche Market Leader | 3–5 Competitors | 40% – 60% SOV | Protect category leadership and narrative control |
| Niche Challenger | 3–5 Competitors | 15% – 30% SOV | Target specific competitor keyword gaps and use cases |
| Mid-Market Entrant | 6–10 Competitors | 8% – 15% SOV | Capture long-tail intent and high-intent comparison queries |
| Broad Consumer Category Leader | 10+ Competitors | 10% – 20% SOV | Maintain top-of-mind mental availability across broad channels |
| Broad Consumer Challenger | 10+ Competitors | 3% – 8% SOV | Build authority across specialized sub-categories |
What Constitutes a Good Share of Voice Benchmark by Industry and Niche?
A "good" share of voice score is relative to category dynamics and commercial intent:
- Niche B2B Verticals: Leaders should aim for 40% to 60% SOV across core intent queries, challengers should target 15% to 30%, and new entrants should strive for 5% to 15%.
- Broad Consumer Categories: Due to high market fragmentation, capturing 10% to 20% SOV signals broad category dominance.
- Two-Player Markets (Duopolies): A 50% SOV represents simple parity; maintaining a lead requires staying consistently above 50%.
Benchmarking should be weighted toward high-intent queries. Winning 80% SOV on informational "what is" queries yields minimal commercial value if your brand has a 0% share on commercial comparison, pricing, and alternative queries where active buying decisions happen.
How Does Excess Share of Voice Predict Long-Term Market Share?
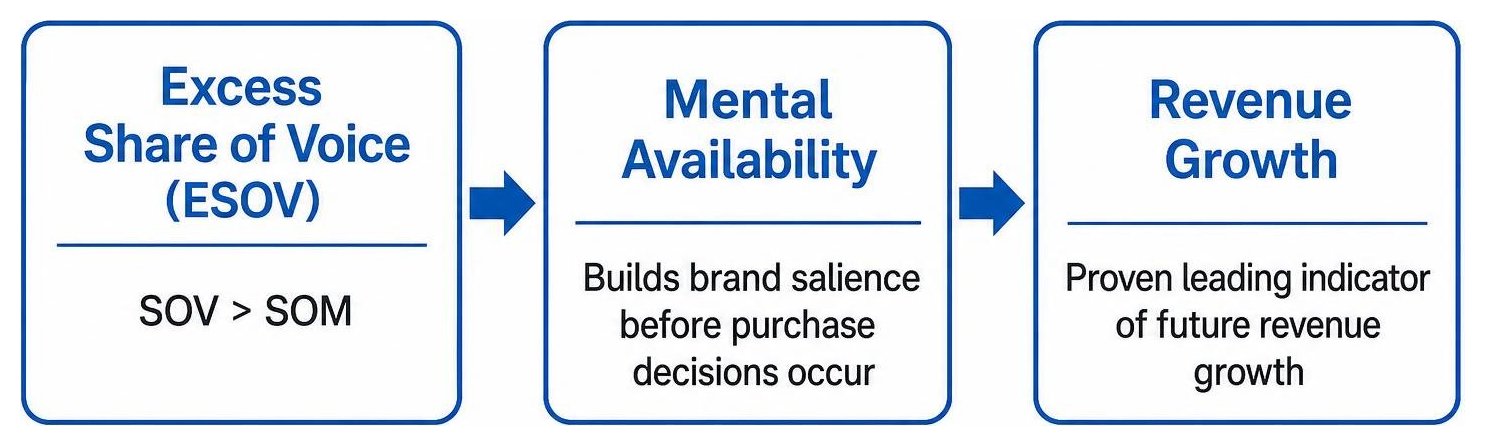
Excess Share of Voice (ESOV) measures the difference between your Share of Voice (how much you are seen and talked about) and your Share of Market (your actual percentage of industry sales):
ESOV = Share of Voice (%) - Share of Market (%)
When your share of voice is higher than your current share of market (SOV > SOM), your excess visibility acts as a proven leading indicator of future revenue growth. Mental availability builds brand salience before purchase decisions occur.
Conversely, when brand visibility falls below market share, sales inevitably decline as competitors capture top-of-mind awareness.
How to Measure, Track, and Improve Your Visibility in Search and AI
Tracking competitive visibility across search and AI platforms requires a standardized measurement workflow. Conducting a comprehensive SEO visibility audit helps identify visibility drops across major engines before they impact inbound pipeline.

How to Build a Share of Voice Benchmark Audit Across Search Engines
To establish an accurate, repeatable share of voice benchmark:
- Define a Fixed Prompt Cohort: Assemble a library of 50 to 100 conversational queries reflecting authentic buyer questions across problem discovery, direct brand comparisons, and use-case queries.
- Track Across Multiple Engines: Monitor queries across ChatGPT, Perplexity, Gemini, and Google AI Overviews. Only 11% of domains are cited by both ChatGPT and Perplexity due to different indexing and retrieval backends; blending scores hides platform-specific weaknesses.
- Count Binary Mentions per Execution: Record whether a brand is present or absent (1 or 0) for each query execution rather than artificially inflating counts with multiple mentions from a single answer.
- Evaluate Over 30-to-60-Day Windows: Generative models fluctuate during index updates and grounding cycles. Track 30-to-60-day rolling trend lines rather than reacting to day-to-day volatility.
- Classify Visibility Gaps: Categorize lost queries into Coverage Gaps (missing content), Citation Gaps (content exists but lacks authority/structure), or Platform Gaps (visibility issues on a specific engine).
What Actionable Tactics Expand Brand Visibility and AI Citations?
To expand organic search real estate and generative AI citations:
- Implement Answer-First Formatting: Structure content with concise definitions, clear HTML tables, bulleted takeaways, and FAQ structured data. Updating product pages with answer capsules and structured tables can increase AI citations by up to 56%.
- Publish Original Data and Industry Benchmarks: Brands in the top 25% for general web mentions earn over 10x more AI citations. Publishing original data makes your domain an essential reference source.
- Maintain Content Freshness: AI citation probability decays at approximately 4% per month without active updates. Regularly refresh statistics, pricing details, and capability lists.
- Optimize Third-Party Footprints: About 83% of citations in Google AI Overviews come from outside the top 10 organic results, often drawing from review directories, industry forums, and independent comparisons. Expanding your presence on third-party validation platforms directly improves AI recommendation frequency.
- Leverage Specialized Optimization Frameworks: Explore our dedicated AI share of voice services to identify competitive citation gaps and systematically build market presence across modern discovery channels.
Turn Visibility Benchmarks into Long-Term Category Growth
Tracking a share of voice benchmark is not about chasing vanity metrics—it is about identifying where competitors are capturing buyer attention so you can close the gap. By establishing consistent prompt cohorts, monitoring both organic search rankings and AI citations, and maintaining a positive excess share of voice, small businesses can systematically expand their market share and outpace larger competitors. Focus on high-intent buyer queries, structure your content for effortless extraction, and monitor your competitive position across every modern discovery channel.