Can Your Comparison Tables Stand on Their Own Two Feet Across the Web?
How Can a Comparison Table Make Sense on Its Own?
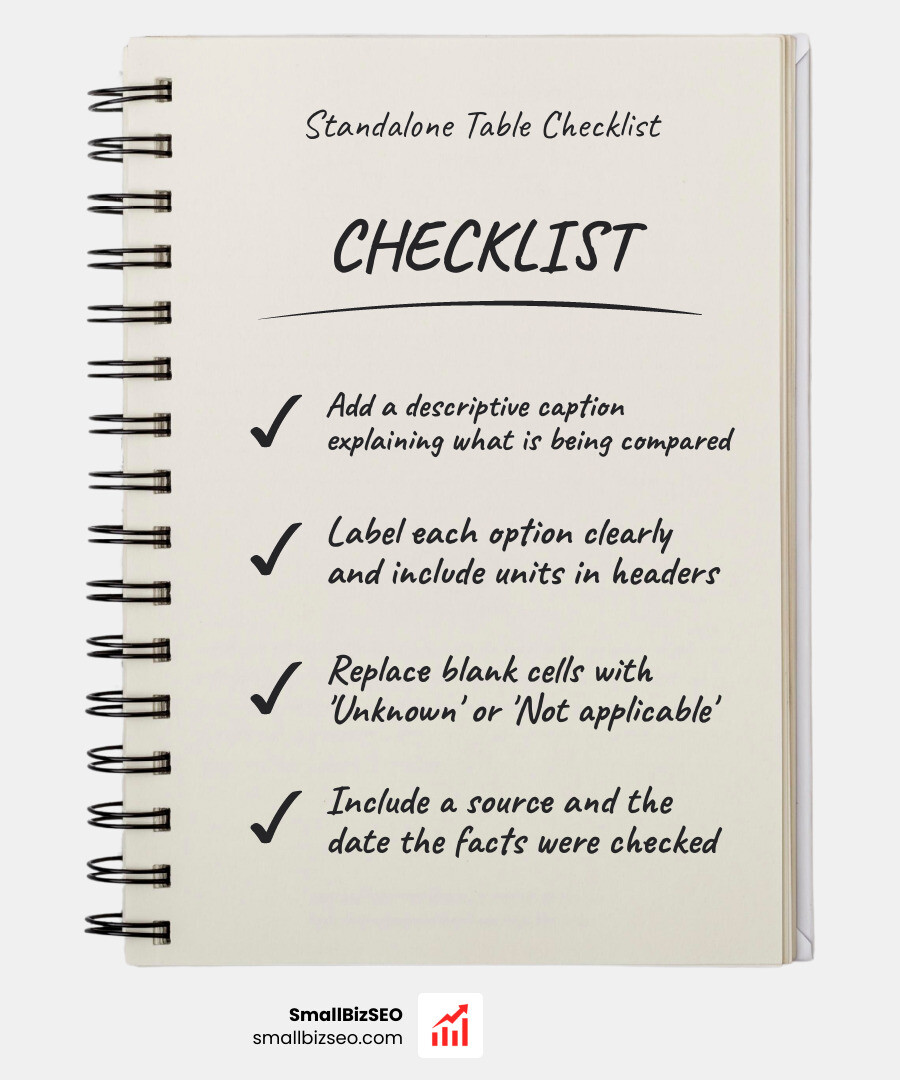
Knowing how to make comparison tables understandable outside their original page starts with one straightforward evaluation: Can someone read the table without the rest of the article? To achieve complete independence, give the grid a clear caption that states exactly what items and criteria are being evaluated. Name each option clearly, include explicit units of measurement in the column headers, and maintain a consistent structure across every row. Replace ambiguous empty cells with explicit labels like "Unknown," "Not included," or "Not applicable." Always provide a verified primary source and fact-checking attribution directly in the table footer.
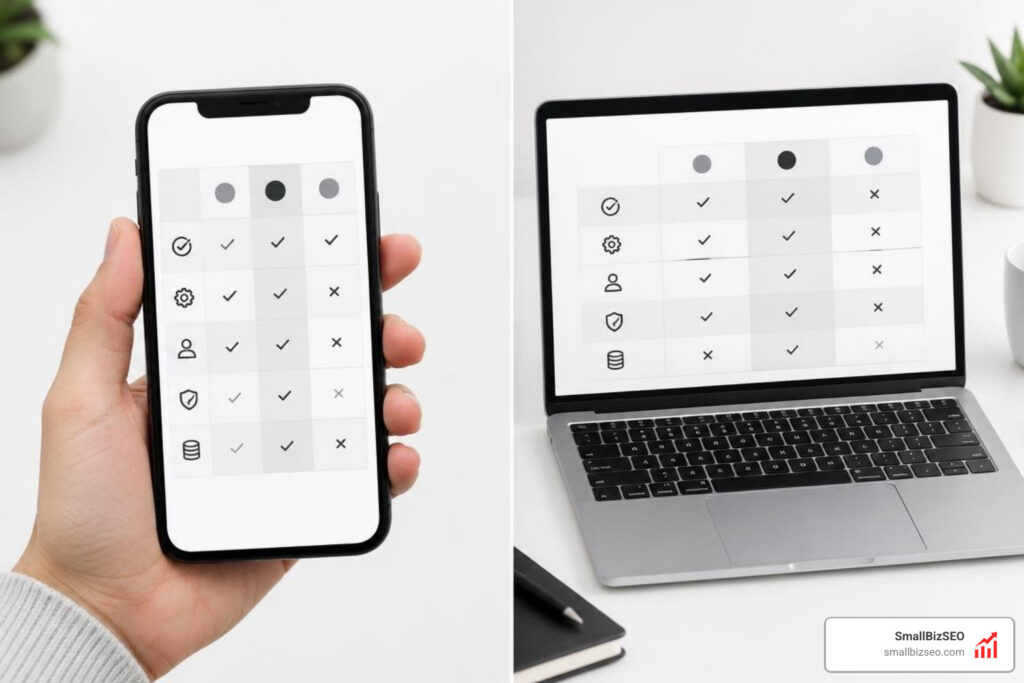
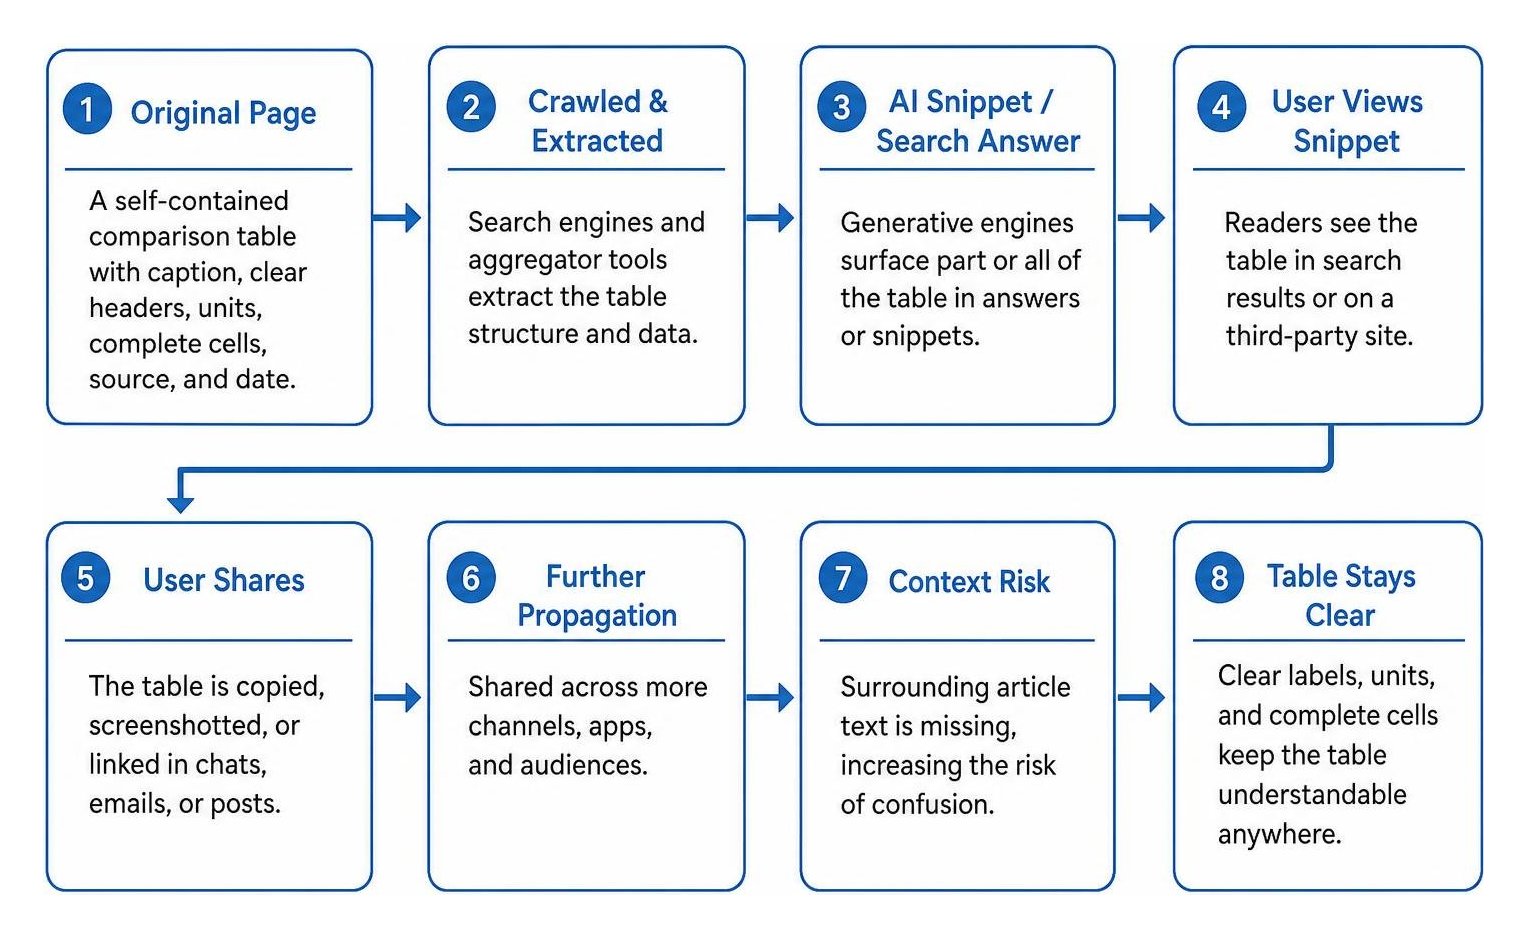
These structural elements become critical whenever data is lifted from its host page. When a table is shared as a screenshot, reviewed on a smartphone, or retrieved by search algorithms for featured snippets, users no longer see the surrounding explanatory text. If an automated snippet extracts only a four-row snippet, descriptive labels and self-contained metrics allow readers to instantly interpret every figure without guessing the underlying context.
I'm Clayton Johnson, founder of SmallBizSEO, where I develop clear, answer-ready assets for growing businesses. That practical standard directs how I demonstrate how to make comparison tables understandable outside their original page, turning fragmented data into durable reference materials.
Core Framework: How to Make Comparison Tables Understandable Outside Their Original Page
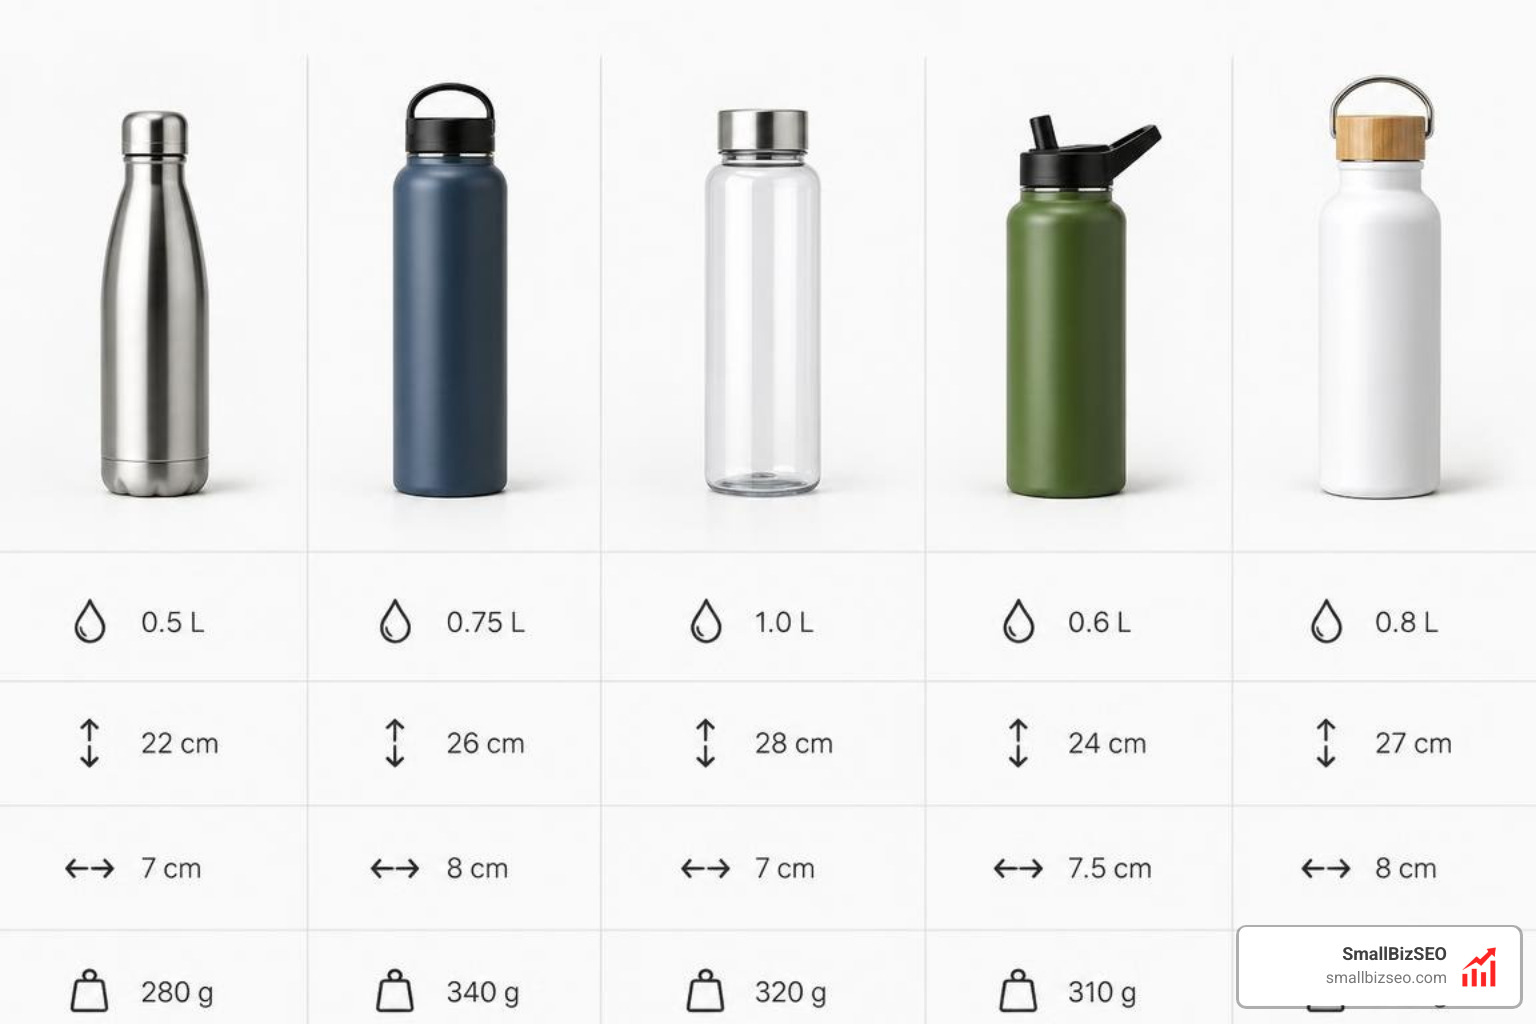
A comparison table is frequently removed from its original publication environment. Content syndication networks, scraper tools, automated crawlers, and AI-driven summary engines regularly isolate table structures. Furthermore, team members routinely capture screenshots or paste raw data into messaging channels. When this displacement occurs, readers lose access to introductory paragraphs, explanatory footnotes, and clarifying definitions that originally surrounded the table.
To prevent this context collapse, we build tables using the Entity-Attribute-Value (EAV) framework:
- Entity: The specific product, service, software tier, or tool being evaluated in the comparison.
- Attribute: The exact feature, performance metric, contractual term, or quantitative criterion under evaluation.
- Value: The unambiguous specification, cost measurement, or capability level associated with that pairing.
Research from NN/G's analysis on product comparison tables demonstrates that structured comparison grids support compensatory decision-making, in which prospective buyers systematically weigh specific trade-offs across multiple product attributes. This cognitive process functions most effectively when limited to a digestible set of 5 to 7 alternatives. When publishers present dozens of crowded options or omit clear unit labels, users encounter cognitive fatigue and decision paralysis.
Creating clean, resilient tables that retain meaning across multiple distribution channels is an essential element of modern website optimization strategies. It guarantees that both human evaluators and automated parsing systems process information without distortion or ambiguity.
What Core Elements Make Table Headers and Data Cells Self-Contained?
Every standalone comparison table requires a clearly designated anchor column, typically positioned on the far left, which identifies the primary entity or product tier being evaluated. Without a distinct anchor column, machine learning crawlers and human readers linearize rows incorrectly, confusing attribute headers with entity names.
Data cells must also remain atomic, meaning each individual cell contains exactly one distinct, verifiable data point. Never compress multi-sentence feature descriptions or disparate variables into a single block of text. As detailed in GetCito's guide to AI-citable tables, uniform and descriptive headers significantly lower computational overhead for search engines, ensuring accurate entity resolution and data extraction.
| Table Element | Ambiguous Design | Self-Contained Atomic Design |
|---|---|---|
| Header Label | Storage | Storage Capacity (GB / NVMe SSD) |
| Pricing Cell | $29 | $29 per user / month (billed annually) |
| Feature Support | Yes | Supported (included in Core plan) |
| Bandwidth | Unlimited* | Unmetered (fair use policy applies) |
Practical Distribution: Multi-Device and AI Search Execution

Over 92% of global internet users access digital content through mobile devices. If a data grid forces readers to navigate clumsy multi-directional horizontal scrolling, engagement drops immediately. Ensuring seamless mobile delivery directly reinforces comprehensive visibility recommendations across diverse devices and screen orientations.
How to Make Comparison Tables Understandable Outside Their Original Page on Mobile and Small Screens
To make comparison tables fully readable on compact mobile screens:
- Constrain Initial Width: Limit visible default comparisons to 3 to 5 core columns to prevent visual clutter.
- Implement Sticky Headers: Lock the top category row and the leftmost anchor column so users always know which item and specification they are viewing while scrolling.
- Use Responsive Stacking or Accordions: Group detailed feature matrices into collapsible categories, as recommended in Mintlify's guide on structured comparison tables.
- Preserve Clean Semantic Code: Use standard HTML table markup (
,
,, ,, ) so screen readers, translation tools, and AI scrapers can parse cell relationships without relying on custom stylesheets. How Can In-Table Context and Definitions Clarify Obscure Metrics?
When specialized technical terms or proprietary benchmarks appear in a table, the matrix fails to stand on its own without accessible definitions.
We resolve this limitation by integrating explanatory context directly into the table interface:
- In-Cell Microcopy: Add concise explanatory notes beneath technical metrics, such as clarifying whether a bandwidth rate represents burst or continuous throughput.
- Inline Definition Links: Hyperlink specialized acronyms to comprehensive reference glossaries so readers can verify technical standards.
- Direct Shareable URLs: Implement anchor-based deep links or copy buttons so users can share exact row selections with collaborators.
At SmallBizSEO, we build structured data assets using our Velocity framework to generate clear, high-performing search visibility. You can see how we establish domain authority by building answer-ready content assets crafted for both automated search engines and real human purchasing decisions.
Making Every Table a Standalone Asset
A comparison table should never depend on surrounding body copy to communicate its value. By clearly defining entities, writing self-contained atomic cells, implementing semantic HTML markup, and labeling missing values explicitly, you transform simple website grids into reliable reference assets that remain clear and trustworthy wherever they appear across the web.