How Branded Query Fluctuation Silently Warps Your Search Console Metrics

Why Can Search Console Averages Be Misleading?
Changes in branded searches can make your sitewide average position look better even while non-branded rankings slip. Search Console weights position by impressions, so a surge of searches for your name at position 1 can pull the average toward 1. To see what is really happening, compare branded and non-branded queries over the same dates. Check clicks, impressions, and position for each group.
I'm Clayton Johnson, founder of SmallBizSEO, where I help small businesses connect SEO reporting with search visibility. My work on how branded query changes distort sitewide average position starts with a simple question: did rankings change, or did the mix of searches change?
In Google Search Console, sitewide average position is calculated as an impression-weighted arithmetic mean, not a simple average of unique keywords. This means queries generating massive visibility heavily dictate your summary metrics. A sudden PR push, seasonal marketing campaign, or offline advertising blitz will inflate branded keyword volume. Because branded terms almost always rank in position 1 or 2, this influx pulls your overall number upward, masking underlying rank decay across competitive non-branded terms.
How Do Branded Query Changes Distort Sitewide Average Position Across Your Domain?
A sudden change in branded search volume immediately skews sitewide average position because branded queries hold dominant positions and earn high impression volumes. When brand interest rises, the sitewide average improves even if commercial keyword rankings drop. Conversely, when branded interest drops, the sitewide average worsens even if non-branded rankings remain perfectly stable.
Understanding how changes in your search landscape interact with Google's reporting system requires looking at query mix volatility. Google records the highest rank your domain achieves for a specific query during an impression event (the top-most position rule). If a user searches for your brand name, you likely rank in position 1.0. If thousands of users perform this search, those position 1.0 impressions dominate the sitewide calculation.
| Query Segment | Monthly Impressions | True Rank Band | Average CTR | Influence on Sitewide Metric |
|---|---|---|---|---|
| Pure Brand Terms | 45,000 | 1.0 – 1.4 | 28.5% | Pulls sitewide position strongly toward 1 |
| Brand + Product Intent | 12,000 | 1.2 – 2.1 | 18.2% | Stabilizes position at top of Page 1 |
| High-Intent Non-Branded | 8,000 | 4.5 – 9.8 | 3.4% | Diluted by high-volume brand impressions |
| Long-Tail Informational | 35,000 | 18.0 – 45.0 | 0.8% | Dragged down by deep rankings across the serp |
When non-branded search volume shifts or new pages begin ranking on deeper pages, macro trends in your analytics dashboard become unreliable without strict segmentation.
What Is the Mathematical Mechanism Behind Branded Query Changes Distorting Sitewide Average Position?
Search Console calculates average position by summing the top rank of every single impression and dividing that sum by total impressions. Because it is an impression-weighted average, high-volume keywords overpower lower-volume keywords regardless of business value.
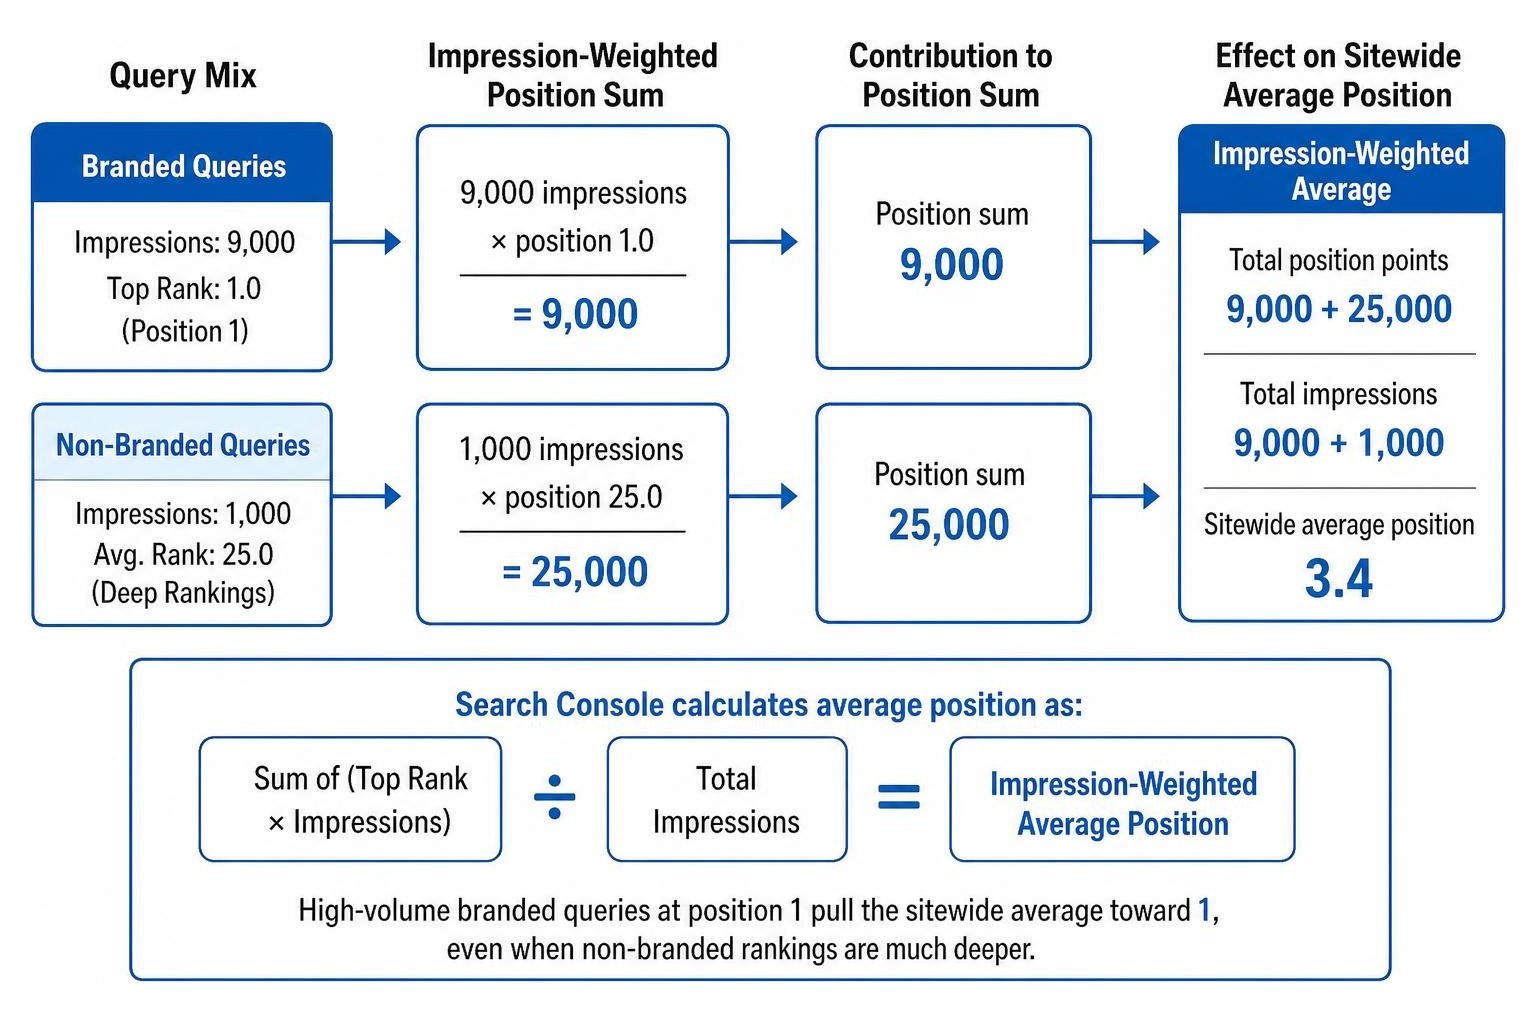
Consider this mathematical reality:
- If you have 9,000 impressions for your brand name at position 1.0, the position sum is 9,000.
- If you have 1,000 impressions across competitive product terms at position 25.0, the position sum is 25,000.
- Combined, you have 34,000 total position points divided by 10,000 impressions, yielding an average position of 3.4.
If your competitive rankings slip from position 25.0 to position 45.0, but brand campaigns increase brand searches to 15,000 impressions, your new calculation becomes 15,000 plus 45,000 divided by 16,000 impressions. Your reported average position is now 3.75. To an executive looking at a monthly dashboard, average position barely moved (from 3.4 to 3.75), yet commercial organic rankings collapsed by twenty full positions.
According to Google Search Console documentation on performance report data, the metric reflects only where a site appeared on average when it was viewed. Expanding your long-tail footprint can produce a similar mathematical paradox. Adding 50 new blog posts might earn 1,000 impressions at position 45, driving your overall position metric from 4.0 to 25.1. While this looks like a massive drop, it actually represents genuine growth into new search territory.
How Can AI Overviews and SERP Features Affect Sitewide Average Position and Clicks?
SERP features and AI Overviews alter the visual layout of search results, frequently displacing organic positions downward without necessarily altering traditional rankings or reported Search Console positions.

Recent industry tracking reveals dramatic shifts in how AI Overviews appear for branded search queries. Data from DemandSphere showed the share of branded keywords triggering an AI Overview averaged around 30% before spiking to 90.48% in a single week. In a separate analysis of 100 enterprise brands by Ahrefs, 48 out of 63 tracked AI Overviews sat directly in position one, visually pushing the brand's own domain down the screen.
This creates subtle reporting anomalies:
- The Position Slip with Stable CTR: A global gaming platform recorded its core brand term slip from position 1.03 to 1.41 on desktop search during an AI Overview expansion, yet overall click-through rates held steady.
- CTR Stability Despite SERP Compression: A national staffing agency saw its branded CTR remain steady at approximately 26.8% while average position drifted from 1.98 to 2.03.
- Zero-Click Informational Interception: Pew Research Center found that searchers clicked a traditional result on only 8% of queries containing an AI summary, compared to 15% of queries without one.
Understanding the impact of AI Overviews on organic CTR is critical for diagnosing whether an apparent position drop is an algorithm penalty or visual layout displacement.
Why Can Sitewide Average Position Hide Non-Branded Organic Traffic Erosion?
A steady or improving sitewide average position often conceals severe non-branded decay through the "crocodile effect"—a widening gap where impressions rise due to broad or branded coverage while clicks steadily plummet.
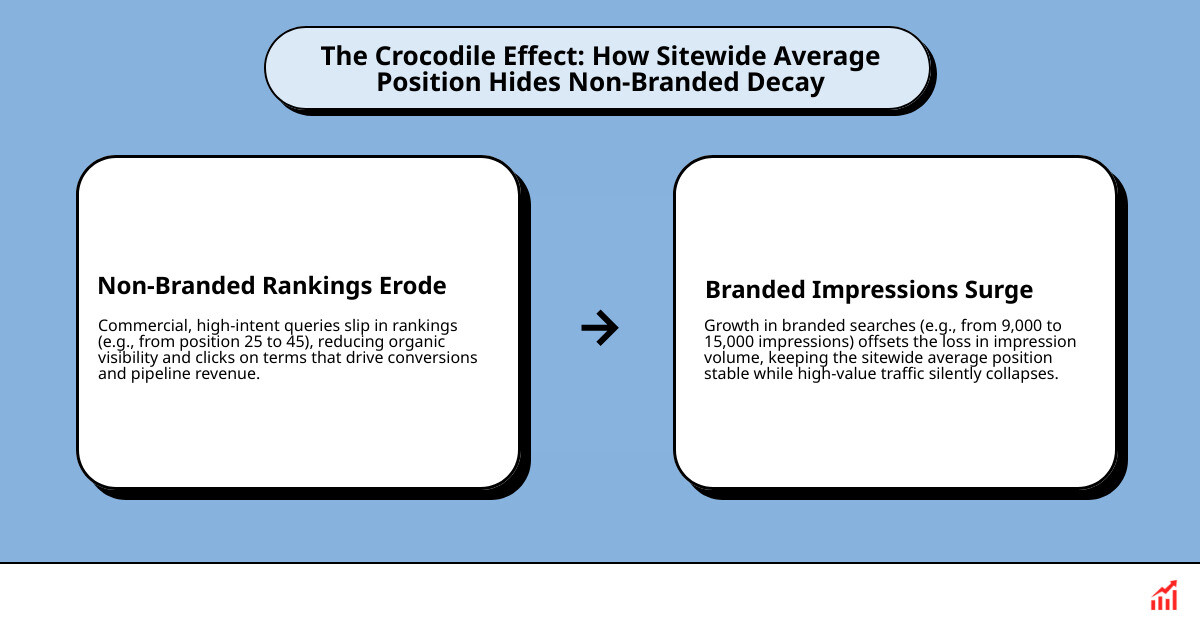
When non-branded rankings erode, your site loses visibility on high-intent terms that drive pipeline revenue and organic conversion. If branded query growth offsets that drop in total impression volume, top-line dashboards show a stable average position. In reality, you are trading high-value commercial prospects for navigational users who already know your company name. Relying on sitewide position alone creates a dangerous blind spot until sales pipelines dry up.
Practical Framework: How Can You Segment, Track, and Fix Warped Average Position Data?
To eliminate metric distortion, separate your search performance into distinct query buckets and audit ranking health using unweighted keyword cohorts.
A thorough detailed SEO analysis requires establishing clean segmentation rules before interpreting macro shifts. Rather than relying on default UI charts that merge all query intents, use this systematic diagnostic workflow:
- Audit the 1,000-Row UI Limitation: Recognize that Search Console export tables truncate data at 1,000 rows. Use the Search Console API or BigQuery bulk data exports to review complete query distributions.
- Establish a Stable Comparison Baseline: Set a reliable reporting baseline using 28-day rolling windows aligned by full weeks to remove weekend cyclicality.
- Separate Anonymized and Rare Queries: Account for queries omitted by privacy thresholds by comparing total property clicks against aggregated query tables.
How Do You Segment Branded and Non-Branded Performance in Search Console?
Isolate query types by applying regular expressions (regex) within the Search Console Performance report, or utilize the dedicated branded query filter tools rolled out in official Google Search Central update on branded query filters.
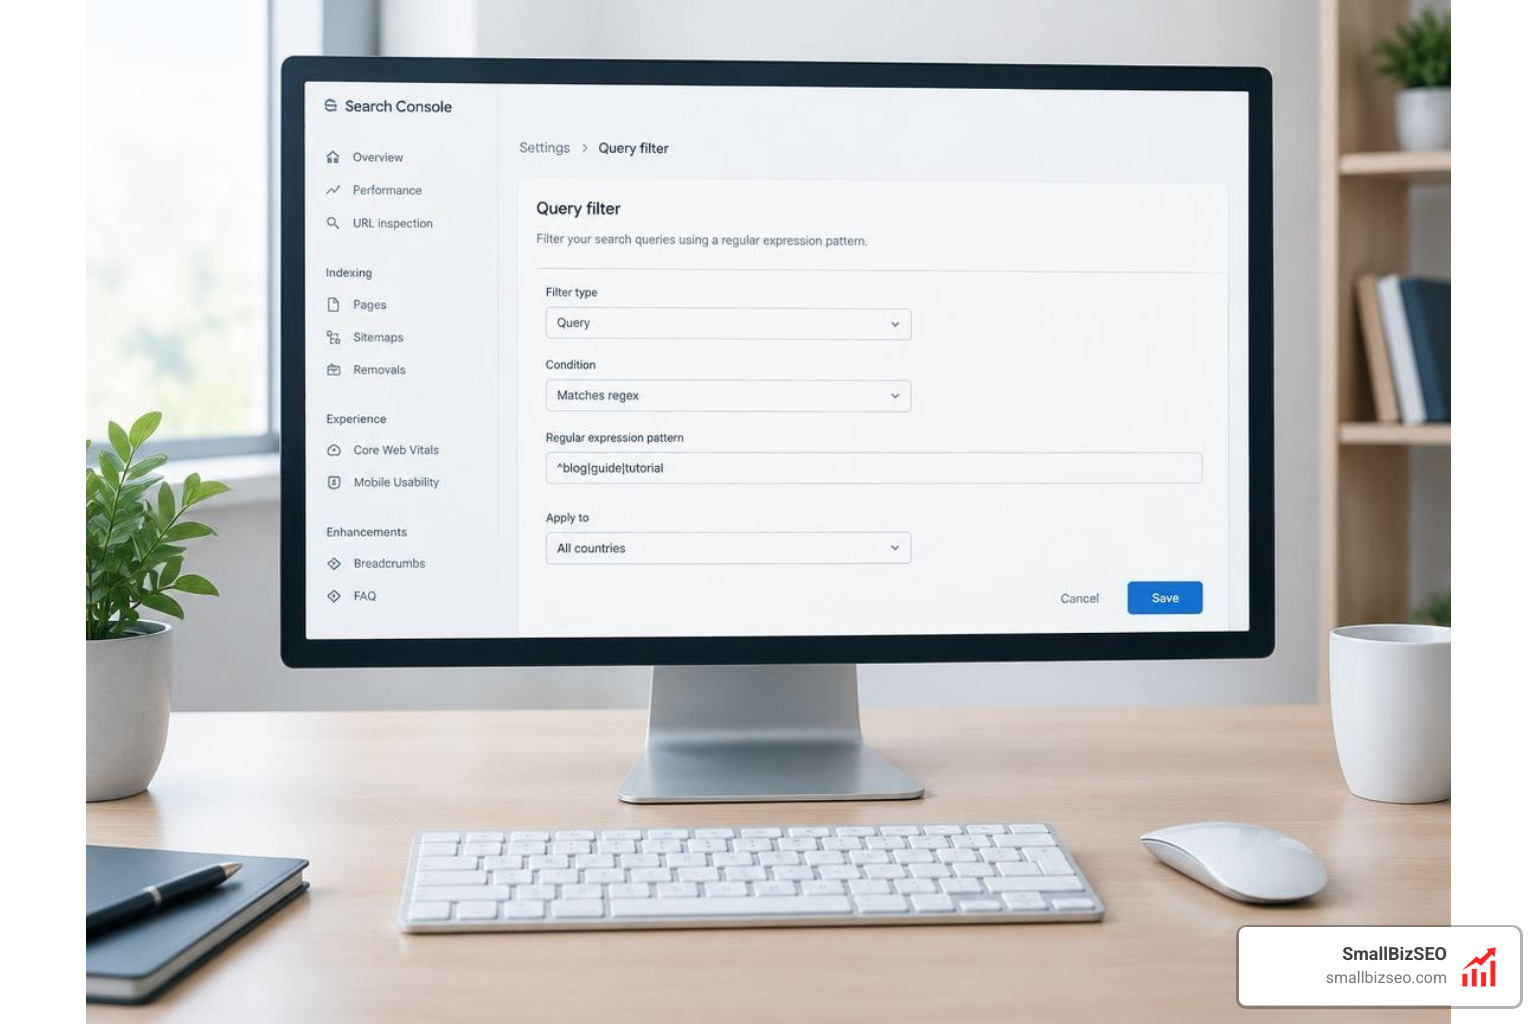
Follow these steps to build clean performance views:
- Build a Master Brand Regex Pattern: Create a regular expression string capturing your core brand name, common misspellings, domain variations, and proprietary sub-products (for example:
brandname|brand name|brand.com|bramdname). - Configure Filter Views: In Search Console, select New Query Filter to Custom (regex) to Does not match to evaluate your pure non-branded performance.
- Isolate Striking-Distance Opportunities: Filter non-branded queries to position ranges between 8.0 and 20.0. These represent pages with solid authority that require targeted content optimization to break onto page one.
- Conduct Week-over-Week Intent Triage: Review non-branded query buckets weekly. If position slips occur while CTR remains flat, inspect the SERP for new snippet features or AI Overviews rather than assuming content quality issues.
Which Metrics Should Replace Sitewide Average Position?
Replace sitewide average position with granular, fixed-cohort tracking and position distribution buckets to get an accurate view of organic progress.
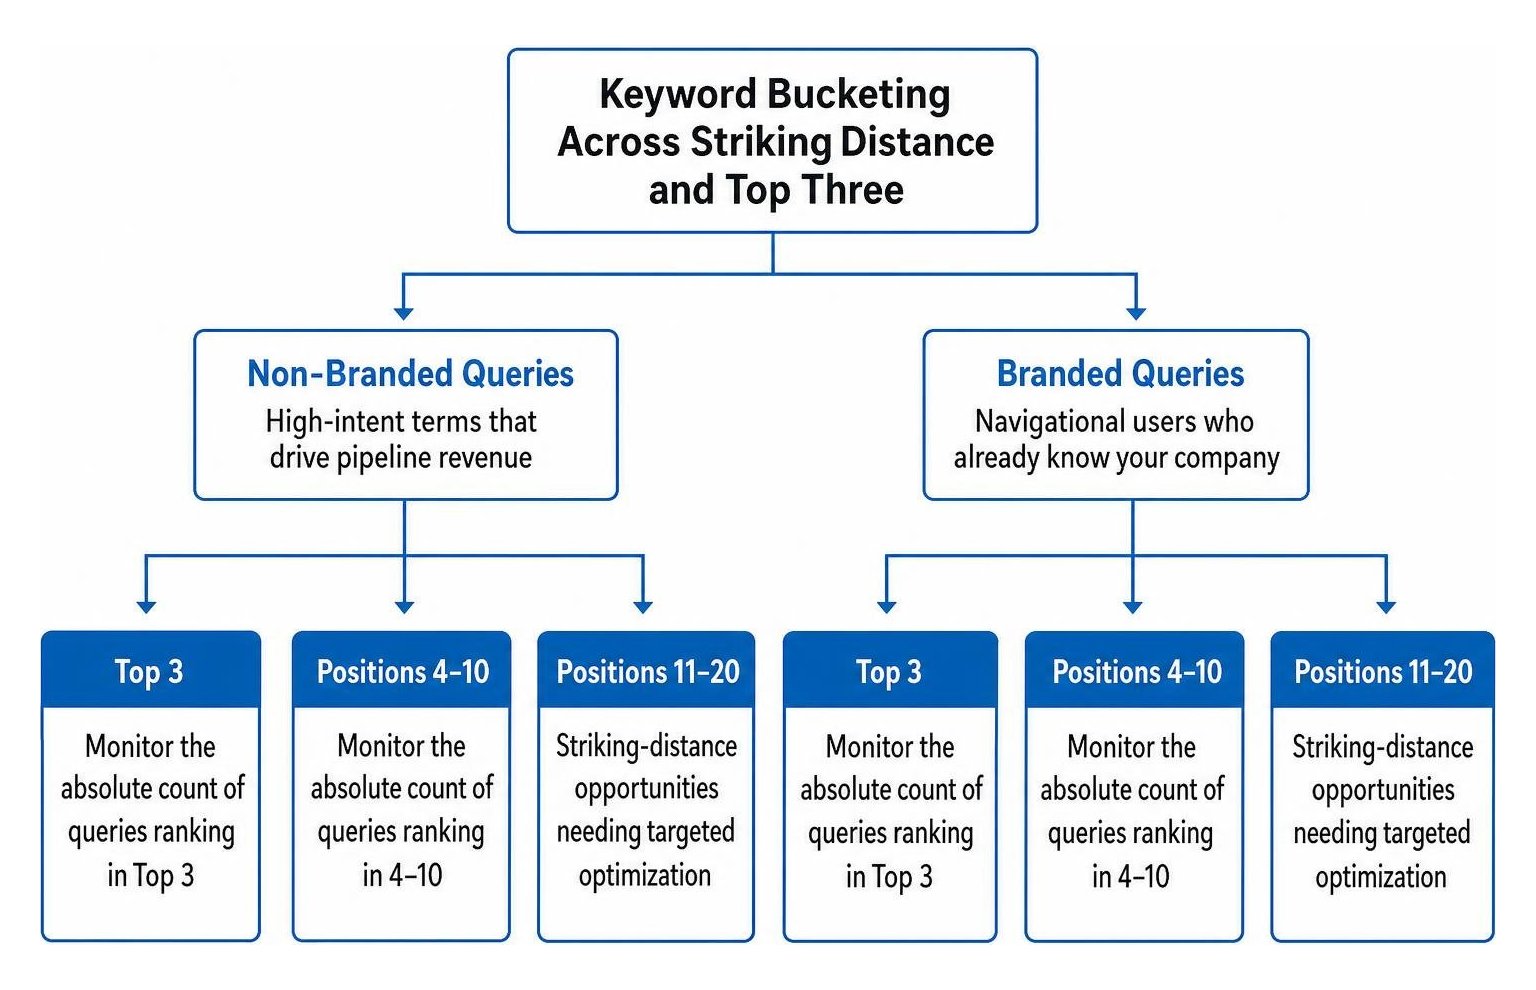
At SmallBizSEO, our data-driven Velocity framework replaces blended averages with actionable performance groups:
- Fixed Keyword Cohorts: Track ranking movements across a defined list of core commercial target keywords rather than an open-ended impression pool.
- Position Distribution Buckets: Monitor the absolute count of queries ranking in Top 3, Positions 4–10, and Positions 11–20. A real-world site with 114 published articles saw its sitewide average position slip from 35.4 to 39.5, yet its top-3 keywords jumped from 0 to 24 and organic clicks grew by 75%.
- Dark Ratio and Residual CTR Monitoring: Calculate the ratio of clicks originating from unlisted long-tail queries versus head terms to gauge real topical authority growth.
Explore our SmallBizSEO average position optimization playbook to build automated reporting frameworks that reflect true commercial search performance.
Beyond the Averages: Building a Clearer View of Search Growth
Averages smooth out nuance, and in organic search reporting, nuance is where revenue lives. Relying on sitewide average position without segmenting branded terms allows navigational searches to mask critical drops in organic reach.
By separating branded queries, tracking fixed non-branded keyword cohorts, and accounting for modern SERP features like AI Overviews, you transform raw Search Console data into an accurate, reliable roadmap for business growth. Focus your measurement on qualified search intent, isolate your data streams, and evaluate your true visibility where it matters most.