Quick Answers, High Bounces: What Your Metrics Are Really Saying
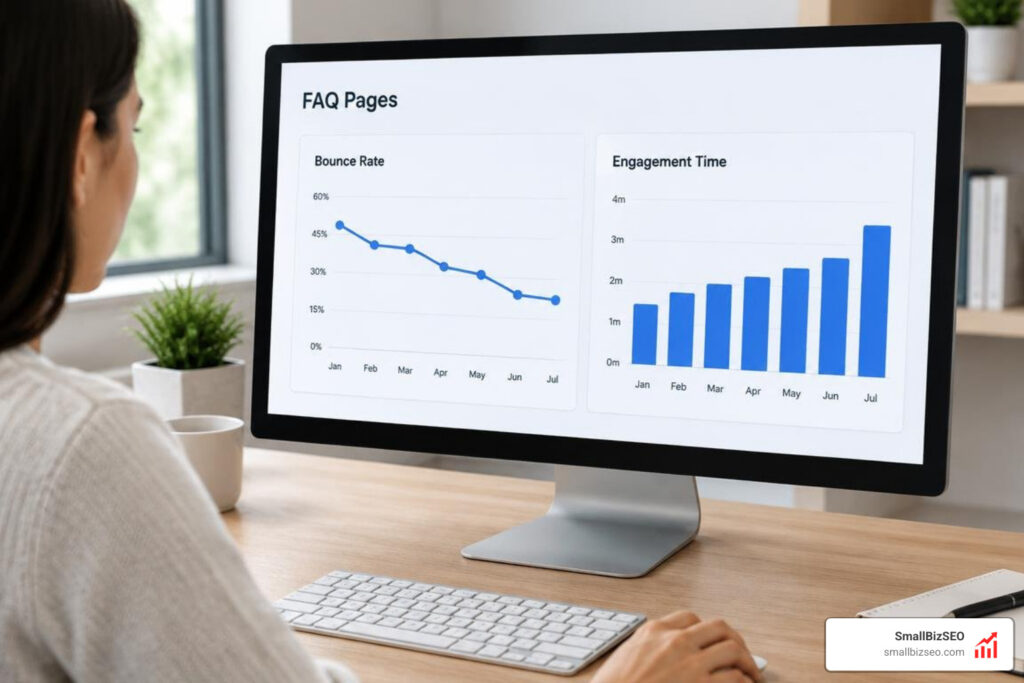
How can you tell whether a high bounce rate means your quick answer worked?
Knowing how to interpret a high bounce rate on a quick-answer page starts with one question: Did visitors find what they came for? Check whether the answer is easy to spot. Then compare bounce rate with engagement time, helpfulness feedback, and actions such as clicks on related links. A quick exit may mean the page did its job; a quick exit with signs of confusion may call for a fix.
FAQ and glossary pages often have high bounce rates, but broad benchmarks are only a starting point. In GA4, a bounce is a session that was not engaged, so check how your analytics tool defines the metric before comparing numbers.
I'm Clayton Johnson, founder of SmallBizSEO. My work in SEO and content strategy has taught me that how to interpret a high bounce rate on a quick-answer page comes down to the visitor's goal, not a single percentage.
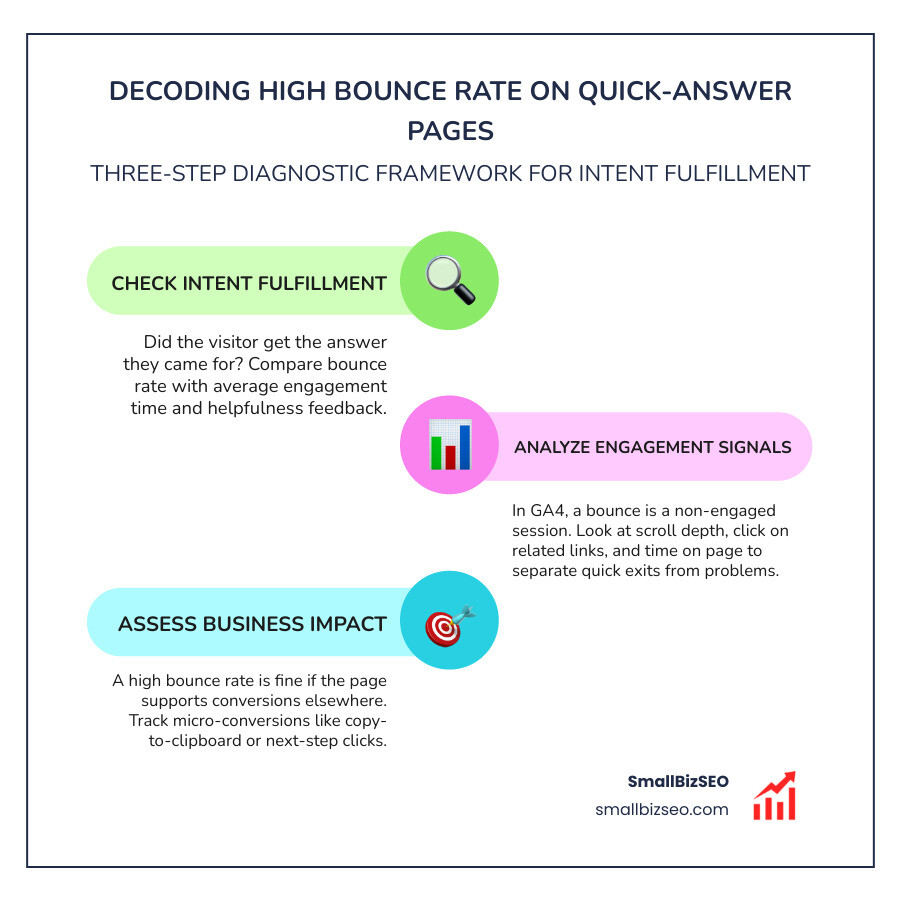
How to Interpret a High Bounce Rate on a Quick-Answer Page: A Step-by-Step Diagnostic Framework
A reliable diagnosis combines intent fulfillment, engagement depth, and business impact rather than judging raw percentages in isolation. Quick-answer resources—such as glossary entries, knowledge base articles, unit converters, and FAQ pages—regularly register a Bounce Rate between 65% and 90%. When a visitor searches for a specific definition or a quick technical fix, their session ends the moment they get what they came for.
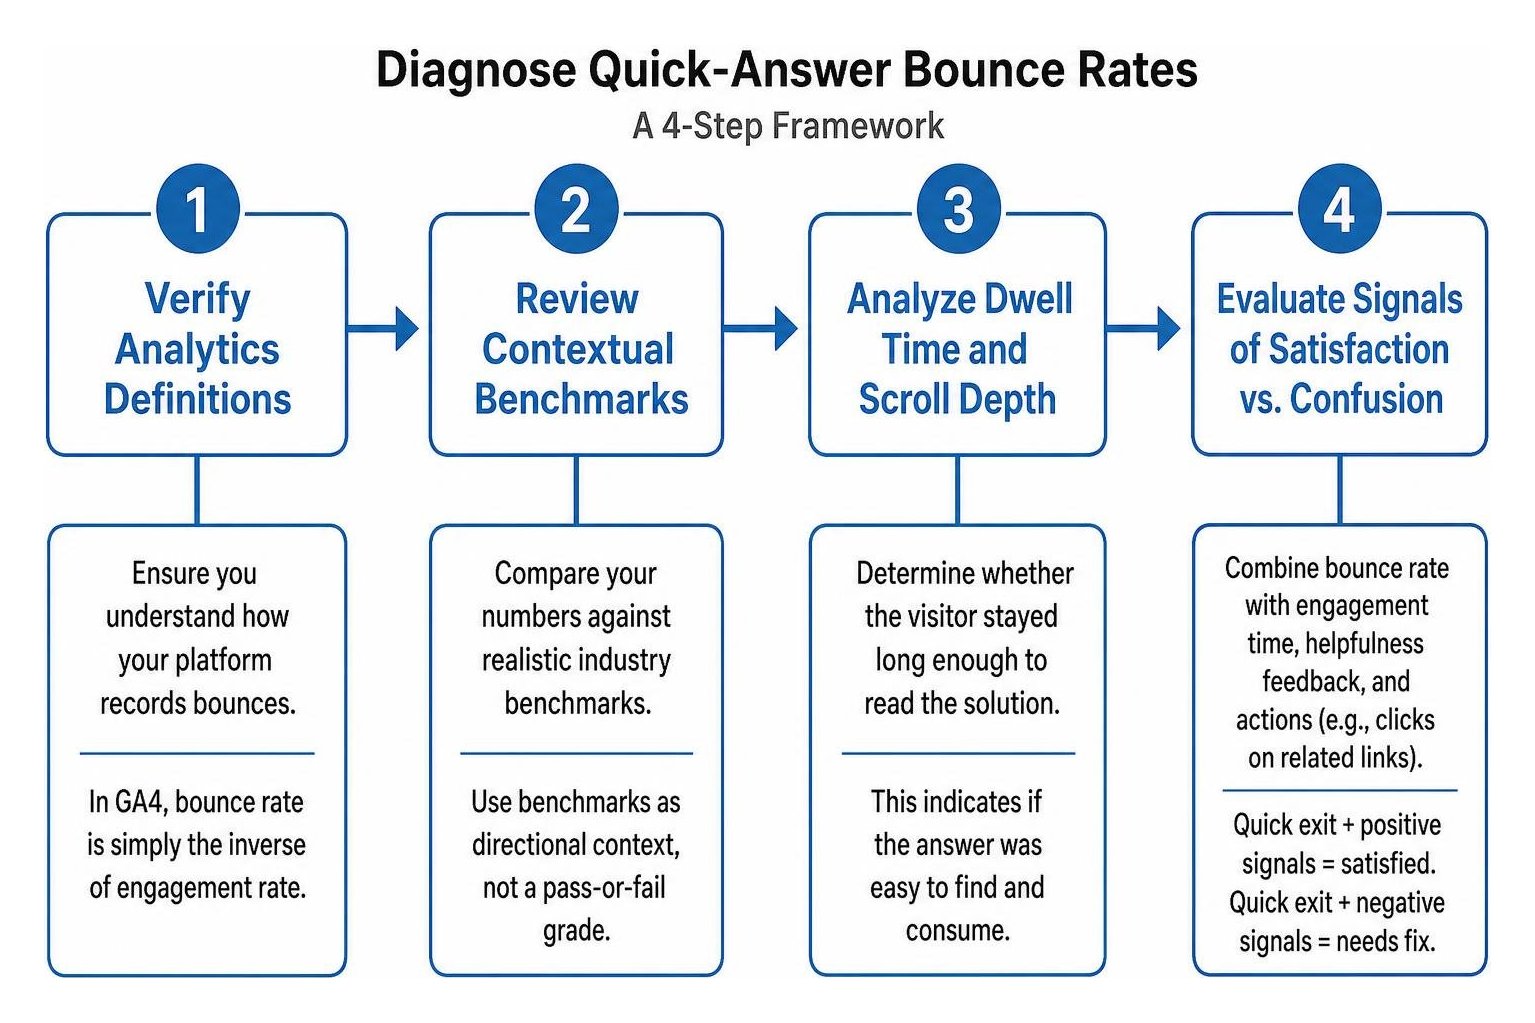
To diagnose the health of your page, follow this systematic four-step framework:
- Verify Analytics Definitions: Ensure you understand how your platform records bounces. Under GA4 Engagement rate and bounce rate rules, bounce rate is simply the inverse of engagement rate.
- Review Contextual Benchmarks: Compare your numbers against realistic industry bounce rate benchmarks as directional context rather than an absolute pass-or-fail grade.
- Analyze Dwell Time and Scroll Depth: Determine whether the visitor stayed long enough to read the solution.
- Inspect Downstream Impact: Check whether the URL assists brand recall, newsletter signups, or subsequent search queries.
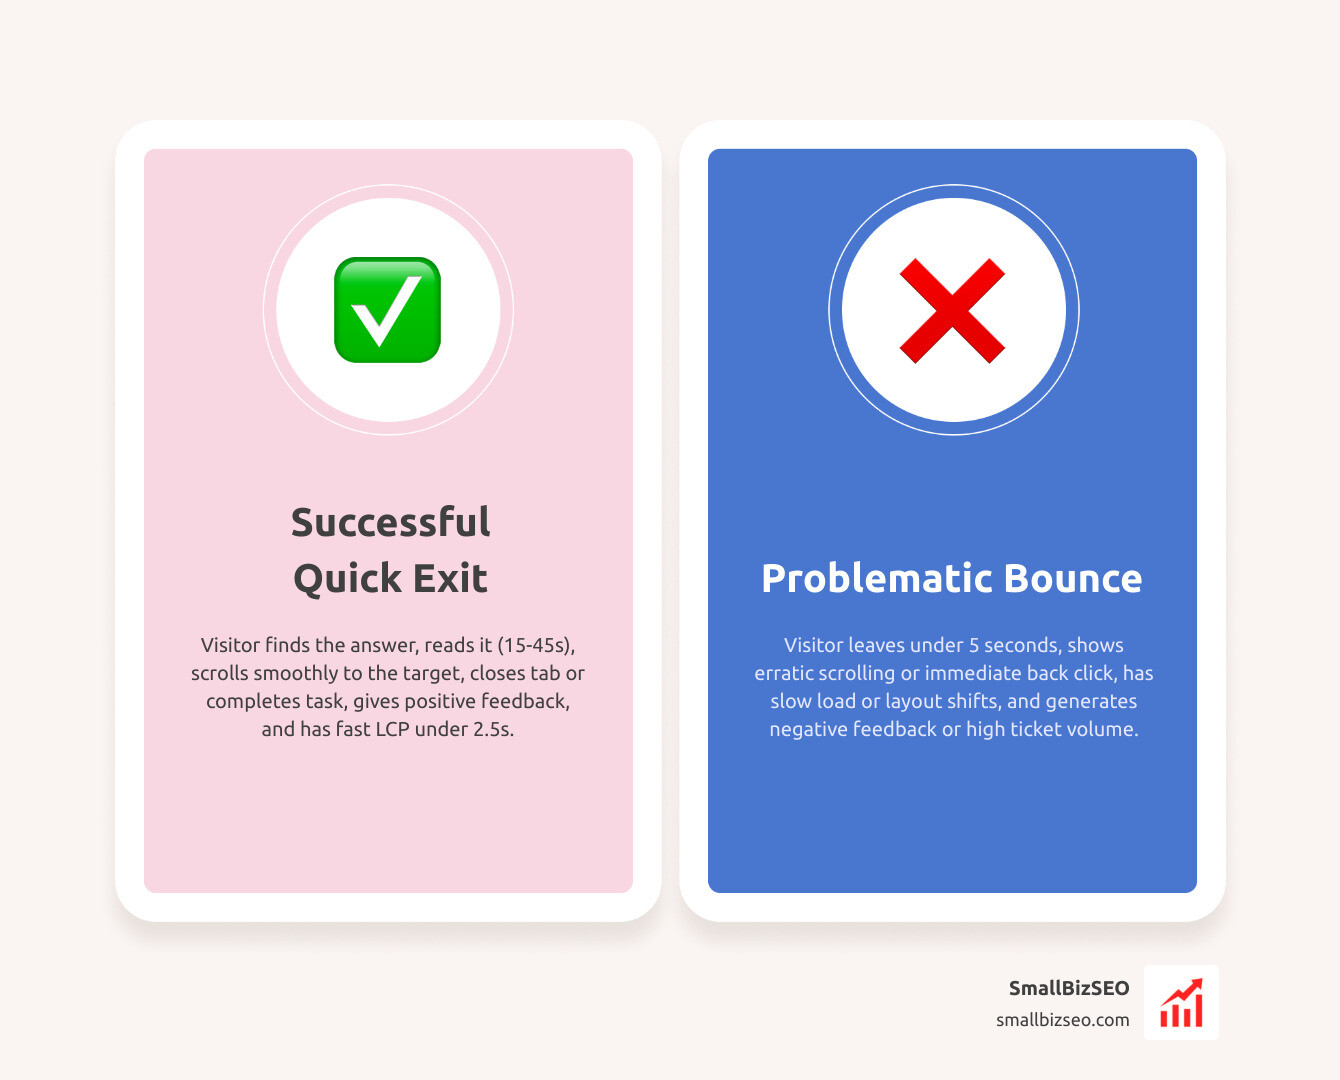
| Signal Attribute | The "Good" Satisfied Bounce | The "Bad" Problematic Bounce |
|---|---|---|
| Dwell Time | 15–45 seconds (sufficient to read the answer) | Under 5 seconds (immediate rejection) |
| Scroll Behavior | Smooth scroll to the target answer block | Erratic scrolling or immediate exit |
| Next User Action | Closes tab or completes task | Immediate "Back" button click to search results |
| Core Web Vitals | Fast Largest Contentful Paint (<2.5s) | Slow load, layout shifts, or blocked content |
| Feedback Widget | Positive ratings ("Was this helpful? Yes") | High ticket volume or negative feedback |
How to Interpret a High Bounce Rate on a Quick-Answer Page Using GA4 Engagement Metrics?
In Google Analytics 4, a session is classified as engaged if it meets at least one of three criteria: it lasts longer than 10 seconds, triggers a key conversion event, or includes two or more page views. If a visitor arrives, reads a 40-word definition over 18 seconds, and leaves without clicking another link, GA4 counts that session as an engaged visit, lowering your bounce calculation accordingly.
Evaluating your Engagement Rate alongside average session duration provides the context that raw bounce metrics lack. A page explaining a quick formula might have an 80% single-page exit rate, yet maintain an 85% GA4 engagement rate because readers spend 25 seconds reviewing the steps.
Understanding why conversion rate shifts between page types helps you set appropriate expectations for informational assets versus transactional landing pages.
How Can You Distinguish a Successful Quick Exit from a Problematic Bounce?
A successful quick exit occurs when a user accomplishes their objective instantly, whereas a problematic bounce happens when technical friction or misleading copy forces them to leave frustrated.
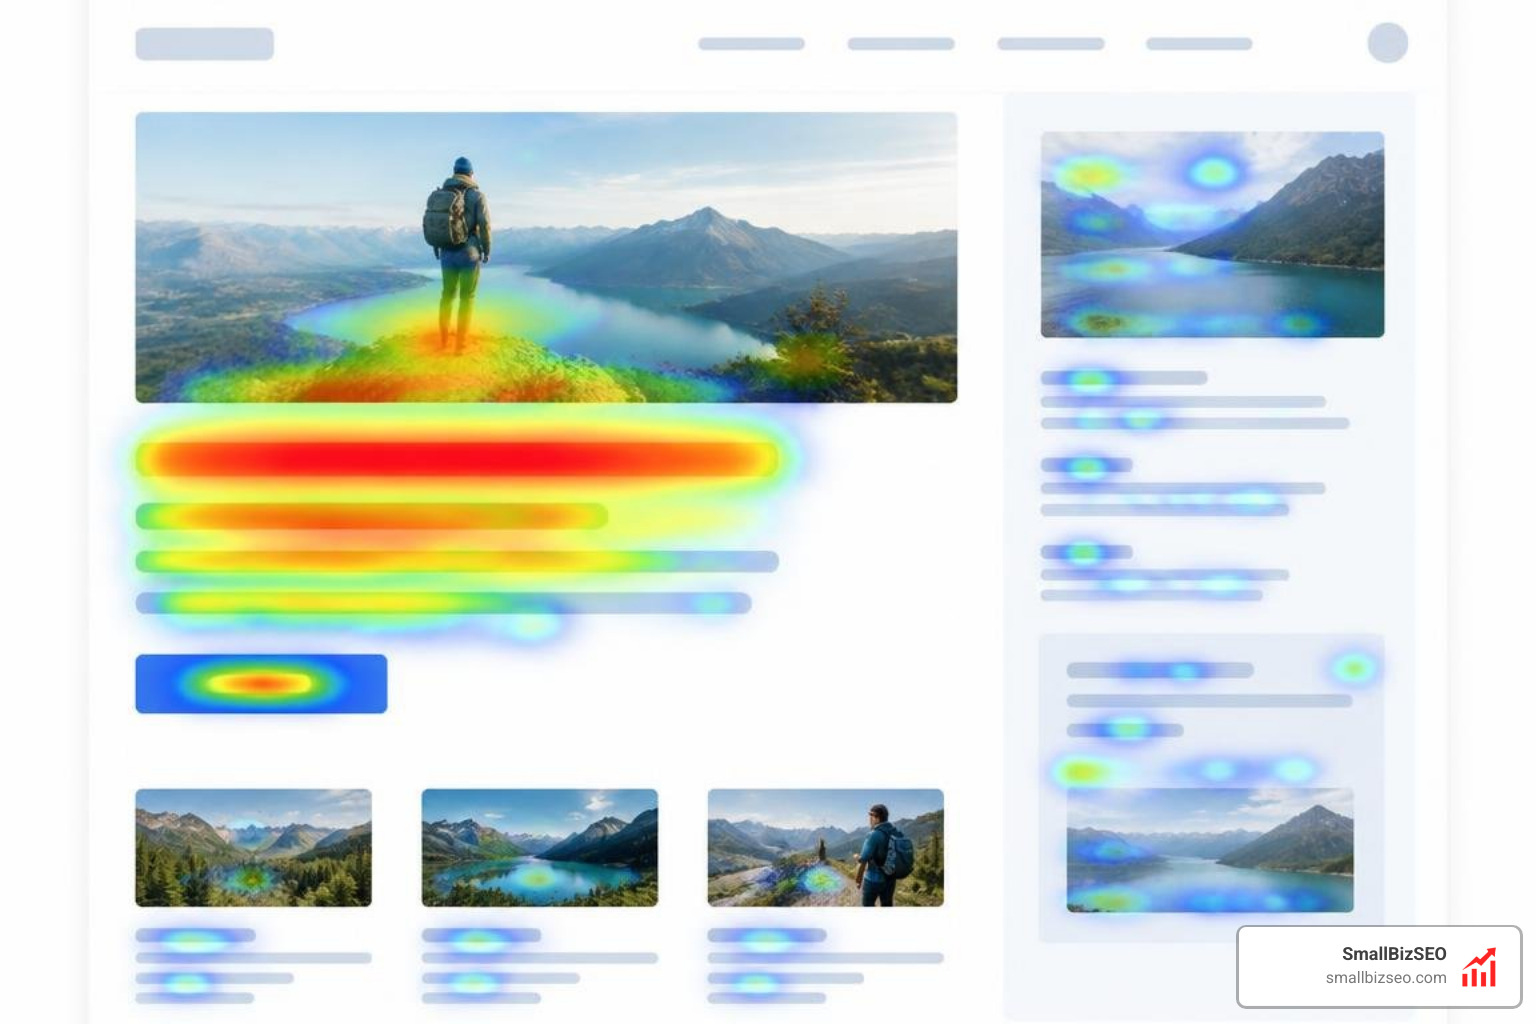
To spot the difference, look for these specific behavioral indicators:
- Quick Backs (Pogo-Sticking): When users bounce back to the search engine results within three seconds, search algorithms register that the query was unfulfilled. Tools like Clarity help with identifying quick backs in user recordings so you can pinpoint where readers encounter friction.
- Speed Barriers: A high Largest Contentful Paint (LCP exceeding 2.5 seconds) causes bounces before your text even renders.
- Copy Alignment: Ensure your content matches reader expectations by answering customer questions accurately right from the opening sentence.
How Does a High Bounce Rate on a Quick-Answer Page Vary Across Devices and Traffic Channels?
Performance metrics vary significantly across different screens and acquisition sources. Across the web, mobile visits average a 51% bounce rate compared to 43% on desktop devices. Mobile visitors operate with lower patience thresholds, making them much more sensitive to heavy banner images, intrusive newsletter modals, and dense paragraphs.
Traffic acquisition channels also shape user behavior:
- Organic Search: Visitors arriving via informational queries often seek a single data point. When the page perfectly aligns with their target Search Intent, single-page exits are normal.
- Paid Campaigns: High bounce rates on paid traffic usually signal mismatched messaging between your ad copy and the landing screen.
- Referral & Direct Channels: These visits frequently represent returning users checking reference documentation, resulting in brief, highly successful sessions.
How Can You Turn Satisfied Bounces into Measurable Growth?
You can convert single-visit readers into long-term audience members by providing logical next steps that do not obstruct the primary answer.
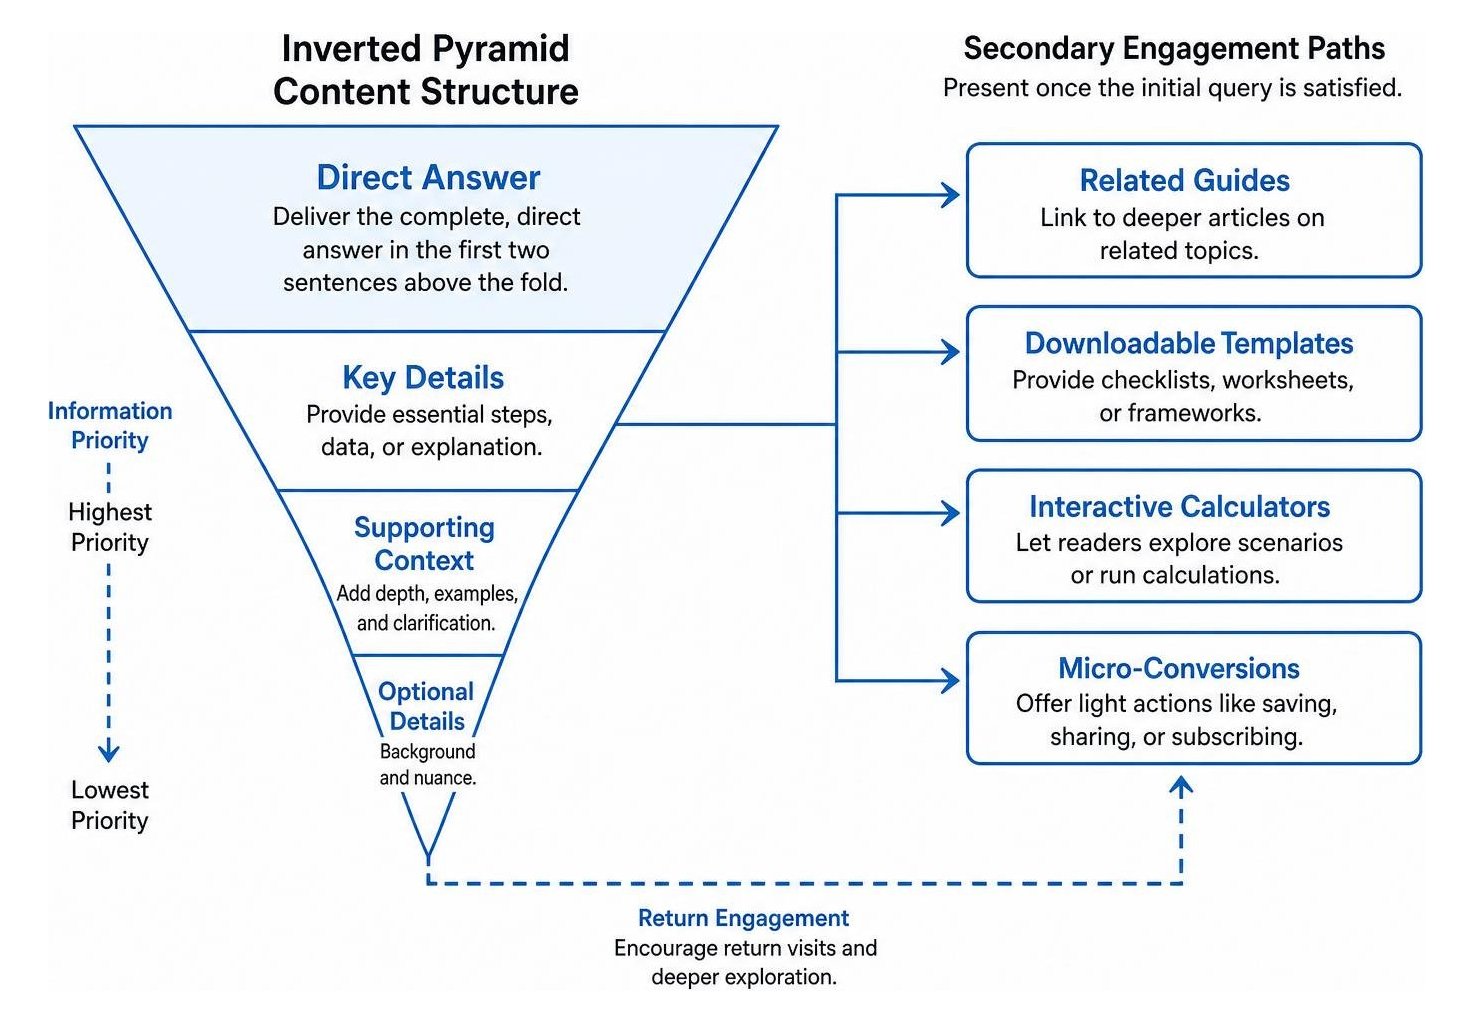
Use an inverted pyramid editorial format: deliver the complete, direct answer in the first two sentences above the fold. Once you satisfy the initial query, present contextual exploration paths such as related guides, downloadable templates, or interactive calculators. For companies auditing their technical architecture, hiring an SEO consultant for bounce rate optimization can help uncover whether high bounce rates stem from user satisfaction or underlying technical flaws.
How Can You Optimize Quick-Answer Content and Micro-Conversions?
Retain visitor interest without adding clutter by offering valuable, lightweight micro-conversions:
- One-Click Feedback Widgets: Place simple "Did this answer your question?" buttons directly below the answer block to capture satisfaction metrics.
- Interactive Tools: Add embedded calculators, unit converters, or quick checklists that invite users to interact directly on the page.
- Copy-to-Clipboard Buttons: Allow developers and professionals to copy snippets, formulas, or summaries with a single click.
- Contextual In-Text Pathways: Link naturally to deeper diagnostic guides and complementary resources.
- Sticky Secondary Navigation: Provide subtle headers that keep relevant category pages easily accessible as users scroll.
How Can You Set Up Custom Event Tracking for Meaningful User Interactions?
To capture accurate engagement data beyond basic pageviews, configure custom event triggers in Google Tag Manager that fire based on visitor actions.
Implement event tracking for key micro-interactions:
- Answer Helpfulness Rating: Track positive and negative clicks on your feedback widgets using custom event tags.
- Scroll Milestones: Set thresholds for 25%, 50%, and 75% scroll depth to verify if users read past the initial snippet.
- Asset Interaction: Monitor clicks on external references, copy buttons, and expandable FAQ accordions.
- Assisted Conversion Attribution: Track how informational visits contribute to later signups across multi-touch journeys.
At SmallBizSEO, we integrate these behavioral signals into our proprietary Velocity framework, pairing technical SEO and content strategy with transparent, automated reporting to drive sustainable organic growth.
Moving Beyond Raw Bounce Metrics
Evaluating your website metrics requires looking past vanity numbers to understand actual user satisfaction. When your content delivers fast, authoritative solutions to common industry questions, a high single-page exit rate often reflects a seamless user experience. By measuring GA4 engagement rates, monitoring Core Web Vitals, and tracking helpfulness micro-events, you can accurately distinguish between successful visits and opportunities for UX improvement.
Ready to uncover what your website metrics are truly saying about your organic performance? Contact us today to request an SEO visibility audit and discover how our data-driven frameworks can accelerate your search visibility.