Uncover the Impact of Google AI Overviews on Organic Search Traffic
How can you tell whether AI Overviews changed your organic clicks?
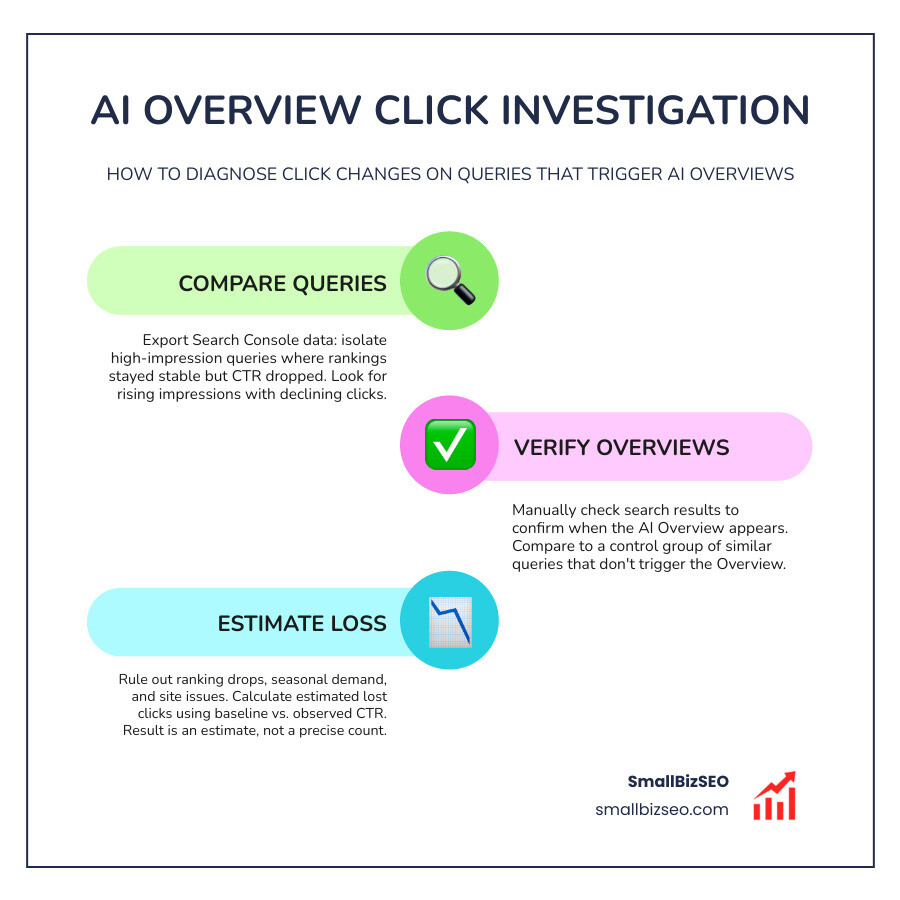
Compare clicks, impressions, click-through rate, and average position for the same queries before and after an AI Overview appears. Check the search results to confirm when the Overview shows, then compare those queries with similar ones that do not trigger it. Keep country, device, and search intent consistent, and rule out ranking drops, seasonal demand, and site changes before estimating lost clicks.
The result is an estimate, not a count of clicks taken by AI Overviews. Google Search Console does not separate those clicks from other Google Search clicks. That distinction matters: in a Pew Research Center study, users clicked a traditional result on 8% of visits with an AI summary, compared with 15% of visits without one.
I'm Clayton Johnson, founder of SmallBizSEO. My background in SEO, content strategy, and AI-driven discovery informs how to investigate click changes on queries with ai overviews, starting with the evidence you can check.
How to Investigate Click Changes on Queries with AI Overviews
How to Investigate Click Changes on Queries with AI Overviews Using Search Console Data
To uncover traffic shifts, export your query-level performance data from Google Search Console and isolate high-impression terms where rankings remained stable while click-through rates fell. Look specifically for the signature pattern: rising or flat impressions paired with declining clicks and unchanged average positions.
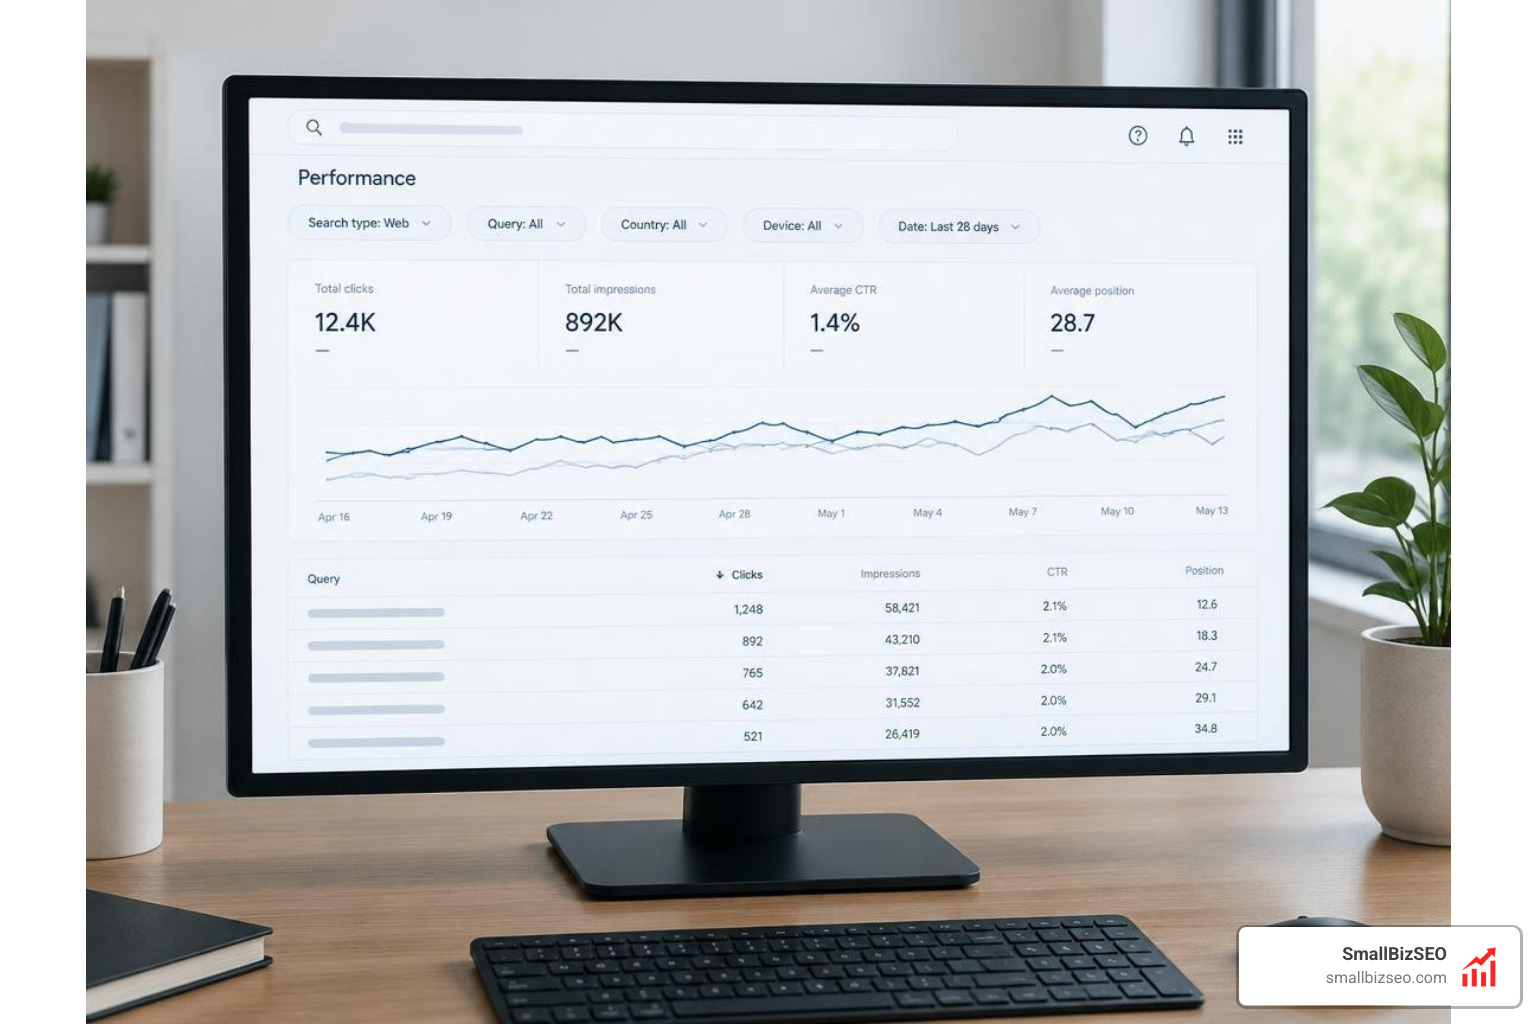
Google Search Console logs AI Overview impressions and clicks within your standard web search metrics. Because there is no separate traffic parameter for these interactions, uncited impressions inflate your total visibility numbers while lowering your overall click-through rate.
To analyze your data cleanly:
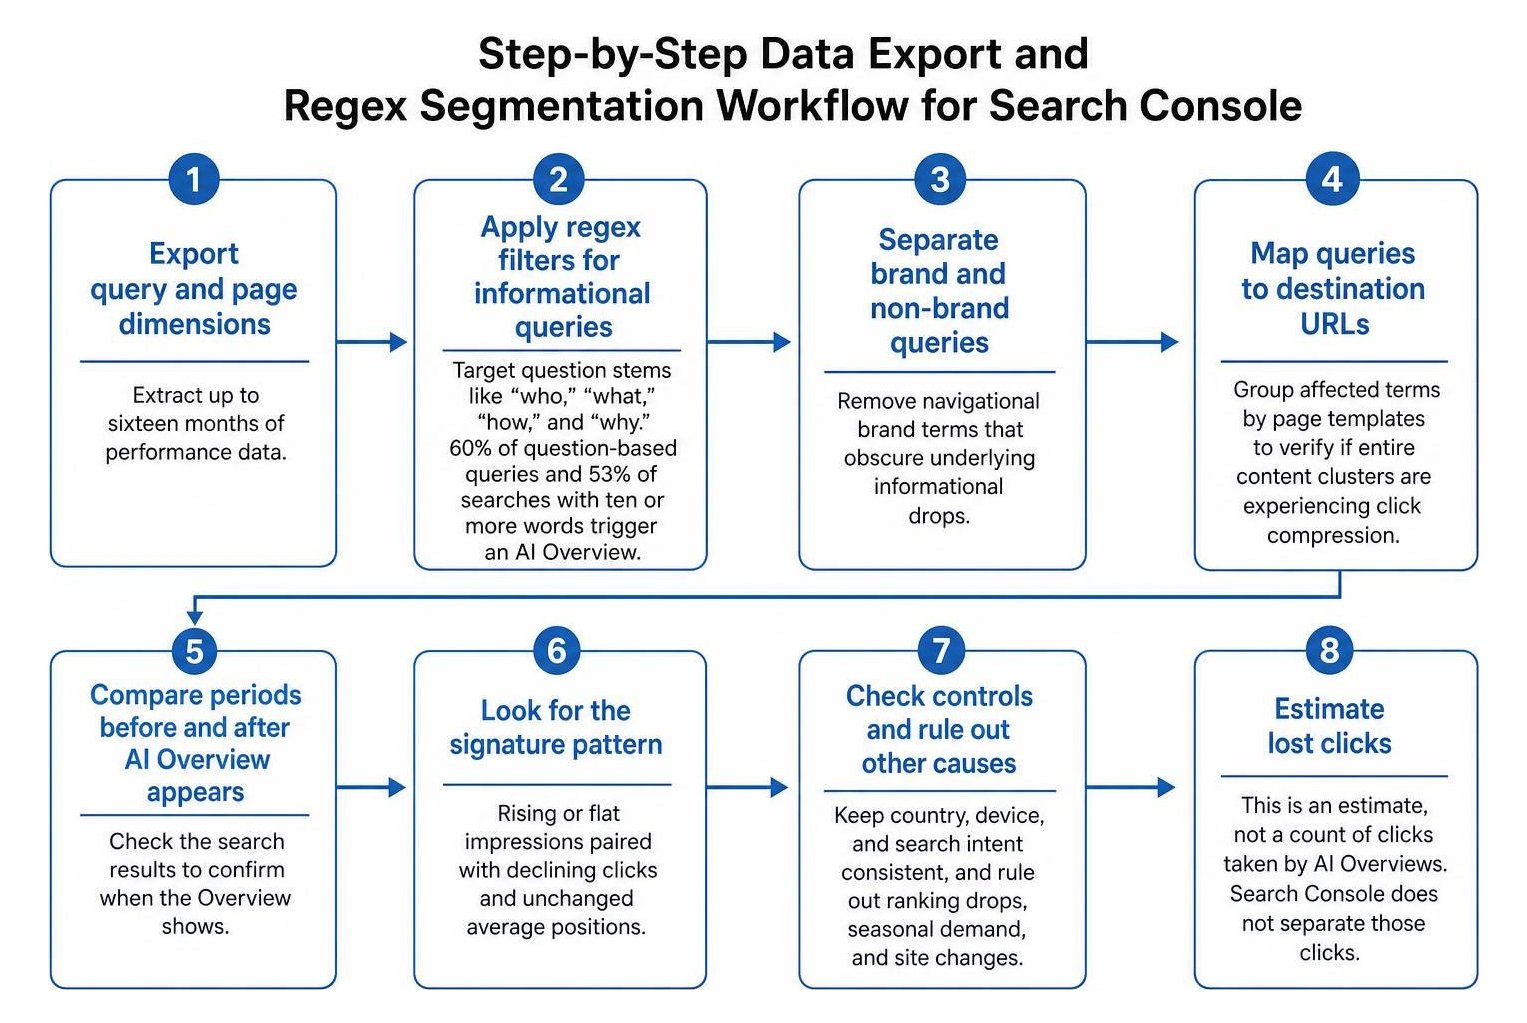
- Export query and page dimensions: Extract up to sixteen months of performance data to compare periods before and after generative search features appeared.
- Apply regex filters for informational queries: Target conversational, multi-word terms using regex patterns for question stems like "who," "what," "how," and "why." Research shows that 60% of question-based queries and 53% of searches containing ten or more words trigger an AI Overview.
- Separate brand and non-brand queries: Understand how branded query fluctuation silently warps your Search Console metrics by removing navigational brand terms that obscure underlying informational drops.
- Map queries directly to destination URLs: Group affected terms by page templates to verify if entire content clusters are experiencing click compression.
Why Do Clicks Drop When AI Overviews Trigger?
Clicks decline because generative summaries resolve user queries directly on the search engine results page, pushing traditional blue links further down the screen. This creates a severe zero-click search environment where searchers get complete answers without visiting source websites.
Industry organic CTR benchmarks show that when an AI Overview generates, standard organic click-through rate falls from 1.76% to 0.61%—a 61% reduction. For position-one organic listings, click-through rates drop by 58%.
According to academic research on AI overview click behaviors, users who encounter an AI summary end their browsing sessions entirely 26% of the time, compared to only 16% on pages without summaries. Furthermore, only 1% of visits to pages with summaries result in a click on a link inside the generated response.
Despite the steep drop for uncited positions, securing a featured link inside the summary provides a significant lift. Brands cited within generative responses earn 35% more organic clicks than those omitted.
How to Calculate Estimated Lost Clicks and Isolate Control Groups
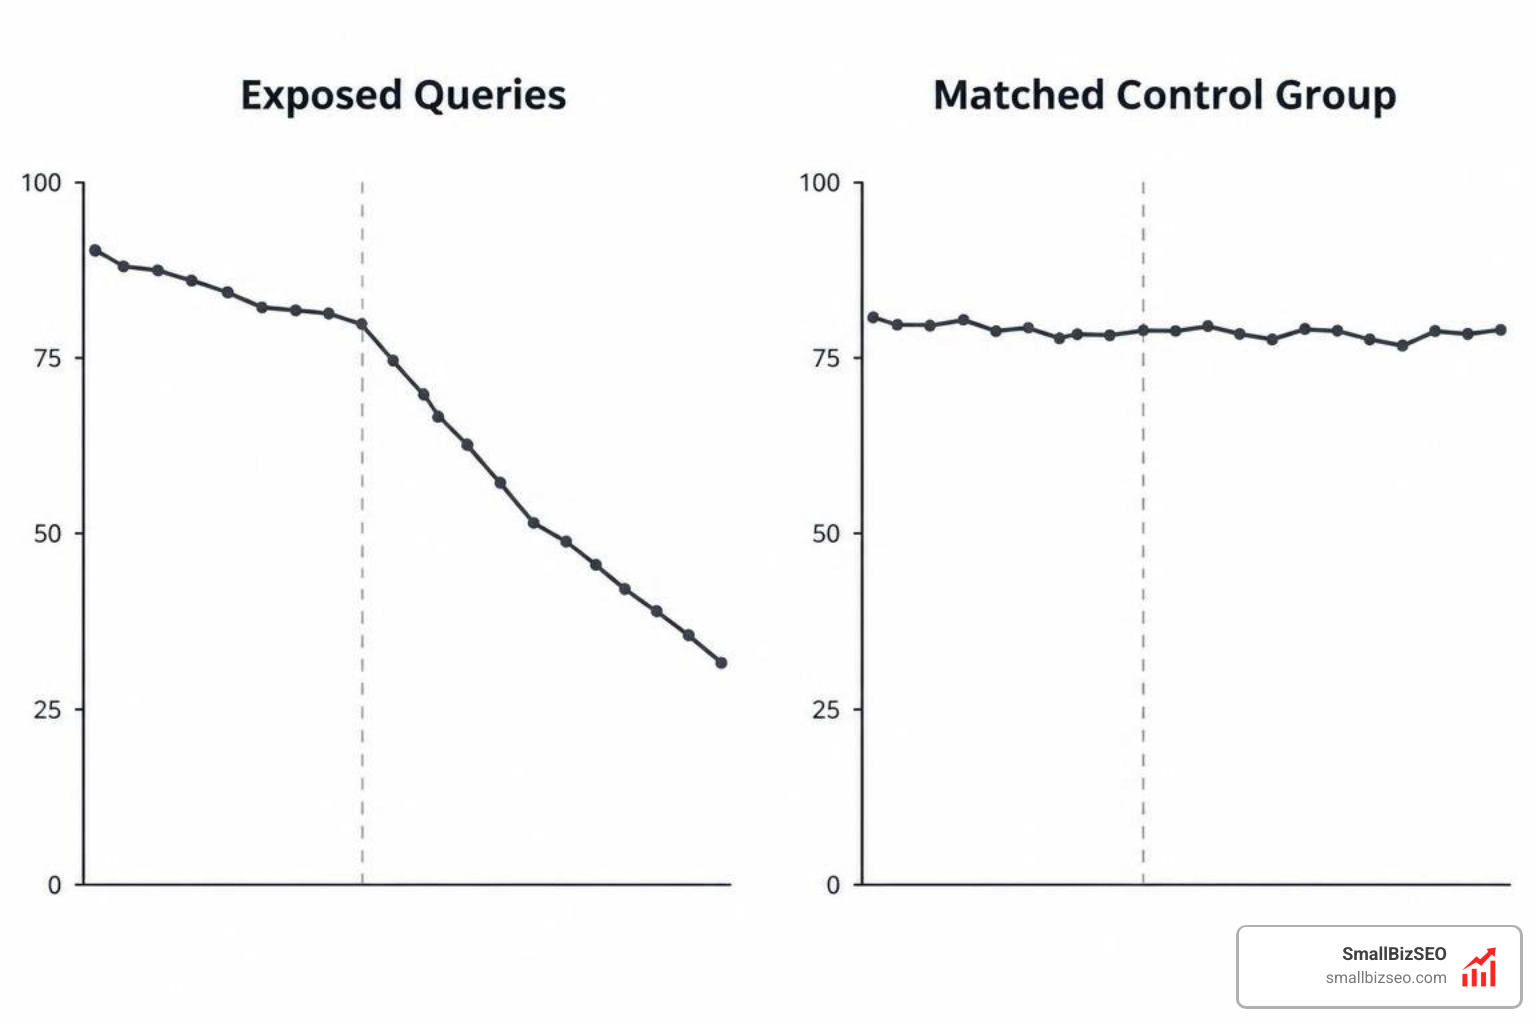
Calculate lost clicks by finding the difference between your historical baseline click-through rate and your observed click-through rate, multiplied by current impressions, adjusted against a control group.
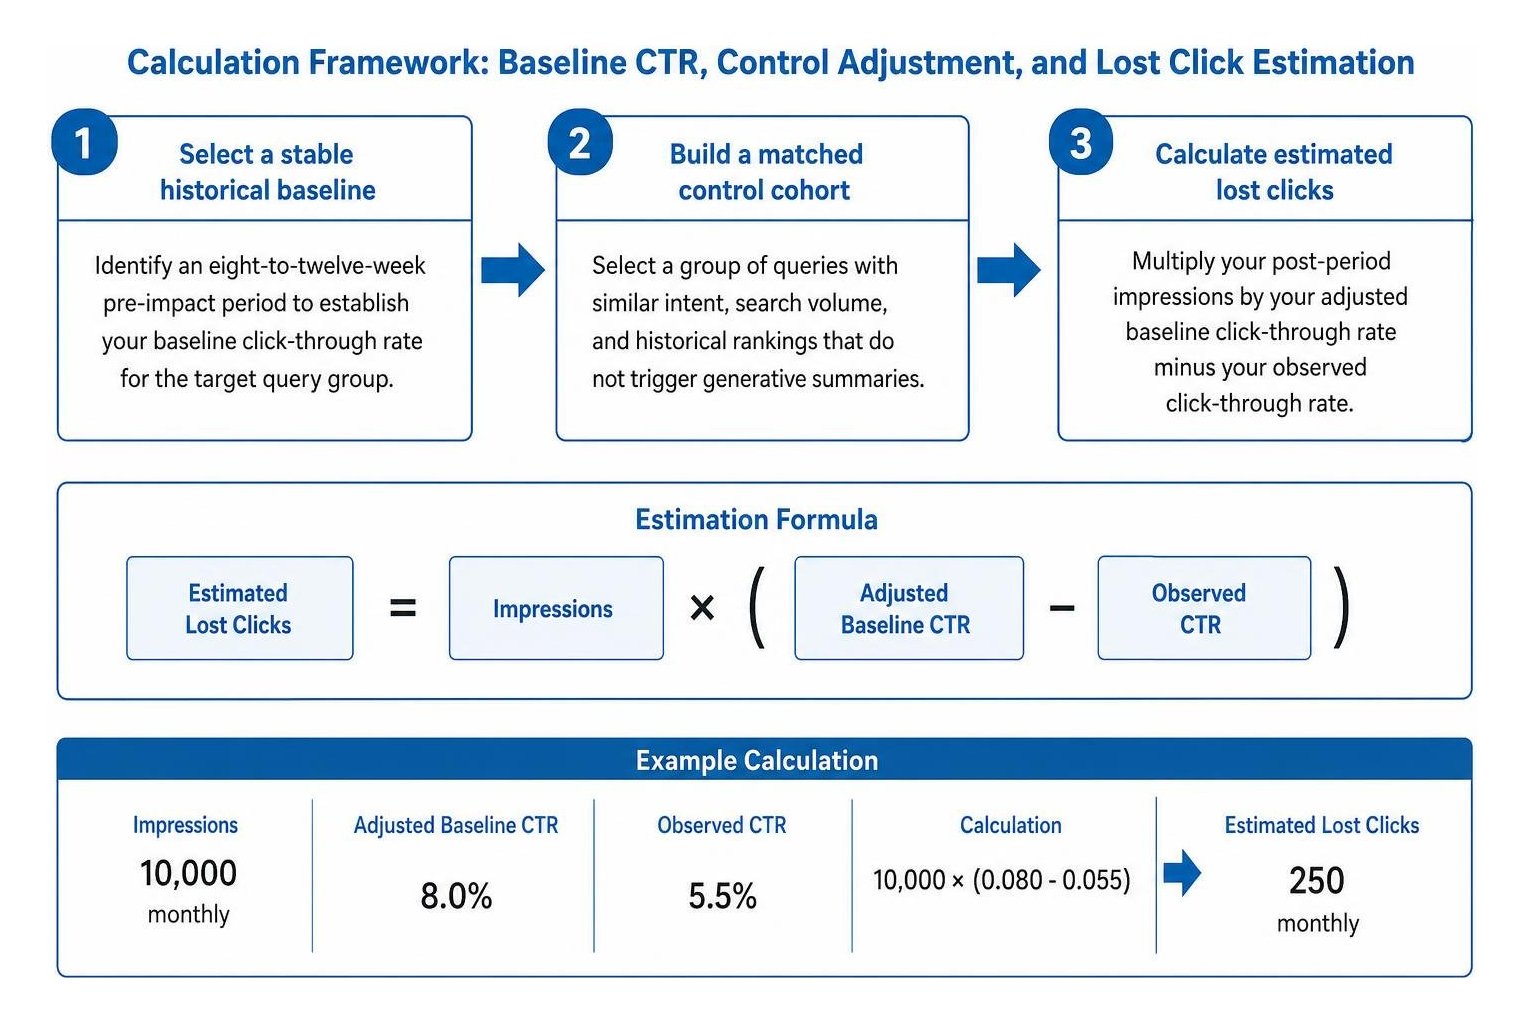
Follow this three-step estimation formula:
- Select a stable historical baseline: Identify an eight-to-twelve-week pre-impact period to establish your baseline click-through rate for the target query group.
- Build a matched control cohort: Select a group of queries with similar intent, search volume, and historical rankings that do not trigger generative summaries.
- Calculate estimated lost clicks: Multiply your post-period impressions by your adjusted baseline click-through rate minus your observed click-through rate:
Estimated Lost Clicks = Impressions × (Adjusted Baseline CTR - Observed CTR)
For example, if an informational query generates 10,000 monthly impressions with a stable top-three ranking, an adjusted baseline click-through rate of 8.0%, and an observed post-rollout rate of 5.5%, your estimated monthly click loss is 250 clicks:
10,000 × (0.080 - 0.055) = 250 Estimated Lost Clicks
Segmenting queries by search intent, device type, and country ensures your control groups reflect genuine user trends rather than broader market anomalies.
How to Investigate Changes in Clicks on Queries with AI Overviews by Ruling Out Alternative Causes
Before attributing traffic declines to search engine layout changes, systematically eliminate traditional performance variables. Market trends and site health issues often mirror generative displacement patterns.
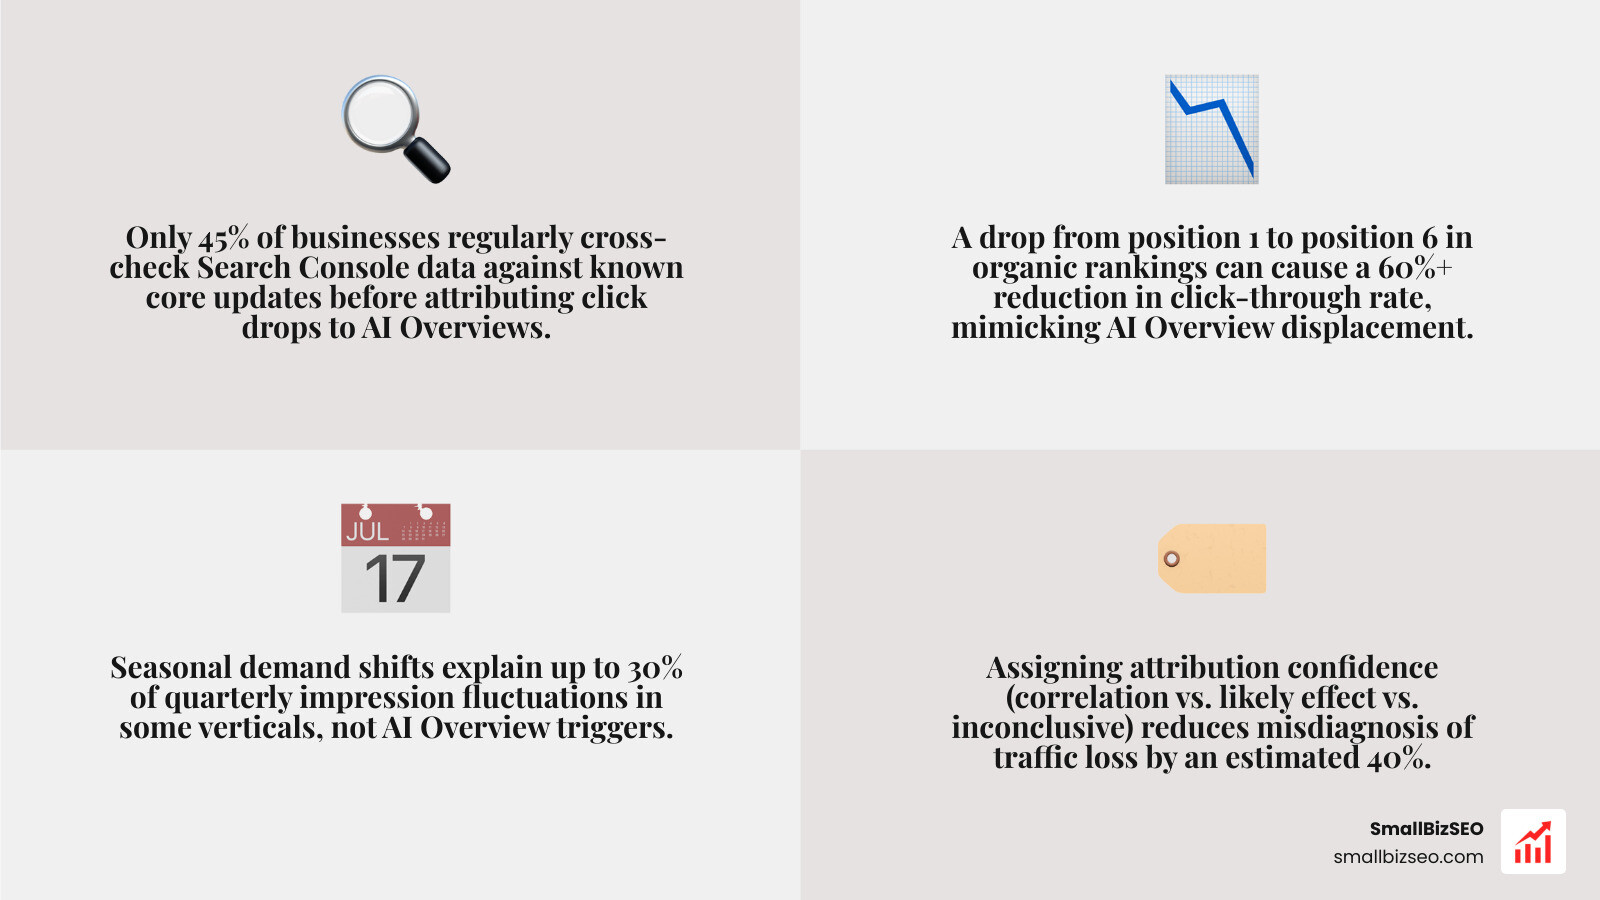
- Check for true ranking declines: Confirm whether your standard organic ranking dropped from position one to position six. True ranking loss indicates relevance or competitor movement rather than summary displacement.
- Isolate broader search volatility and core updates: Review industry tracking sensors to determine if algorithmic re-evaluations shifted organic positions across your vertical.
- Account for seasonal demand shifts: Cross-reference Search Console impressions against multi-year historical trends to ensure lower total volume is not simply standard off-season behavior.
- Audit technical site health: Verify crawl frequency in server logs, confirm canonical tags remain intact, and check robots.txt directives to rule out indexation failures.
- Assign attribution confidence: Label your findings as correlation, likely effect, or inconclusive based on whether rankings and impressions stayed flat while click-through rates fell exclusively on overview-triggering terms.
Measuring Business Impact and Recovering Lost Clicks
How to Build a Monthly AI Overview Click-Loss Scorecard
Build a monthly scorecard that tracks measured clicks, estimated lost clicks, citation status, and downstream conversion impact across affected landing pages.
A comprehensive scorecard monitors portfolio health and quantifies bottom-line business outcomes:
| Query Cluster | Measured Clicks | Estimated Lost Clicks | Citation Status | Downstream Conversions | Attribution Confidence |
|---|---|---|---|---|---|
| How-to Guides | 12,400 | 4,200 | Not Cited | -18% Lead Submissions | High (Likely Effect) |
| Symptom FAQs | 8,100 | 1,850 | Cited (Position 2) | -4% Sign-ups | Moderate |
| Product Pricing | 15,200 | 300 | No Overview Active | Flat | Low (Correlation Only) |
Monitoring your AI citation rate lets you measure how often your content earns inclusion among the three to eight citations typical in summaries. Linking these metrics to conversions helps you evaluate actual AI referral traffic and adjust business forecasts accurately.
Which Dedicated Tools and Audits Fill Free Platform Gaps?
Free Google tools lack real-time feature detection and citation tracking, requiring third-party monitoring platforms and structured manual audits to complete your data stack.
| Capability | Google Search Console & GA4 | Dedicated AI Tracking Tools | Manual 20-Query Audits |
|---|---|---|---|
| Separate Overview Clicks | No (Aggregated with Organic) | Modeled via Scrapes | Observed Directly |
| Trigger Rate Detection | No | Automated Daily/Weekly | Exact Point-in-Time |
| Citation URL Tracking | No | Automated Across Competitors | Manual Inspection |
| SERP Layout Snapshots | No | Stored Visual History | Live Browser Capture |
| Competitor Share Tracking | No | Domain Citation Share | Direct Observation |
Combine automated third-party tools with regular manual spot-checks. Inspect live search pages in private browsing windows to review competitor answer structures, comparison formats, and data tables.
At SmallBizSEO, we use our data-driven "Velocity" framework to deliver fast rankings and transparent reporting. By optimizing content architecture for clear, authoritative answers, our AI Overviews optimization services help small businesses regain visibility, earn valuable citations, and recover lost organic momentum.
Taking Action on Your Search Performance
Investigating click changes requires disciplined cohort analysis, control groups, and clear attribution modeling. By isolating affected queries in Search Console, eliminating technical and seasonal variables, and tracking citation presence, you can turn search displacement into a structured optimization plan. Regularly audit your high-value terms, structure content for direct answers, and protect your digital footprint across evolving search layouts.