Measuring Search CTR Across Equivalent Rankings Without Data Distortion

Why Compare Organic CTR at Similar Search Positions?
To learn how to compare organic ctr at similar search positions, start with Google Search Console data for each page and query. Group results into narrow position bands, separate branded from non-branded searches, and compare clicks divided by impressions within each group. Check device and search intent before treating a CTR gap as a problem.
A site-wide average can hide the answer: a result near the top usually gets more clicks than one lower on the page. And even at the same position, ads or AI Overviews can change how many people click.
I'm Clayton Johnson, founder of SmallBizSEO. My work in SEO and content strategy helps small businesses use their own search data to understand how to compare organic ctr at similar search positions and decide what to improve next.
Understanding Why Blended Averages Distort Search Performance
Blended click-through rates hide critical performance problems because search traffic follows a steep power-law decay. Ranking in position 1 delivers an average CTR between 27.6% and 39.8%, while position 10 delivers a baseline around 2.5%—an 11x drop across page one.

When we lump all rankings together into a single site-wide metric, high-ranking pages mask underperforming pages sitting lower down. The overall average CTR across positions 1 through 10 sits near 8.7%. If you evaluate a position-2 URL earning a 12% CTR against that 8.7% blended number, it looks healthy. In reality, a position-2 listing normally captures around 15.8% to 18.7% of clicks, meaning that page is actively losing traffic.
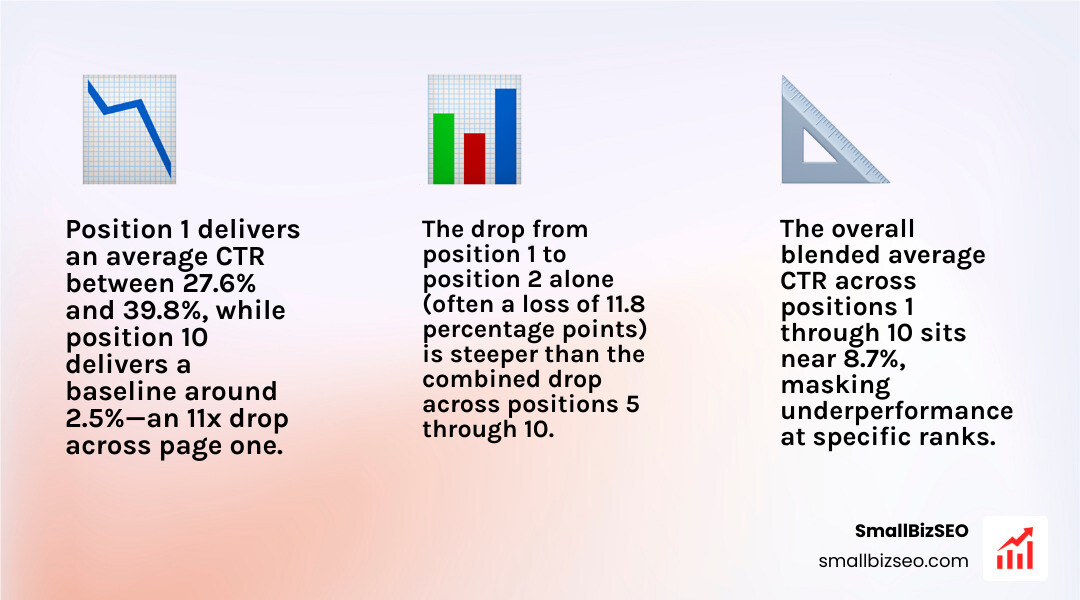
The drop from position 1 to position 2 alone (often a loss of 11.8 percentage points) is steeper than the combined drop across positions 5 through 10. Evaluating performance requires isolating specific positions rather than relying on blended averages.
Step-by-Step Guide: How to Compare Organic CTR at Similar Search Positions
To compare CTR accurately across equivalent rankings, isolate page-query combinations, filter out low-volume statistical noise, and calculate position-specific weighted averages.
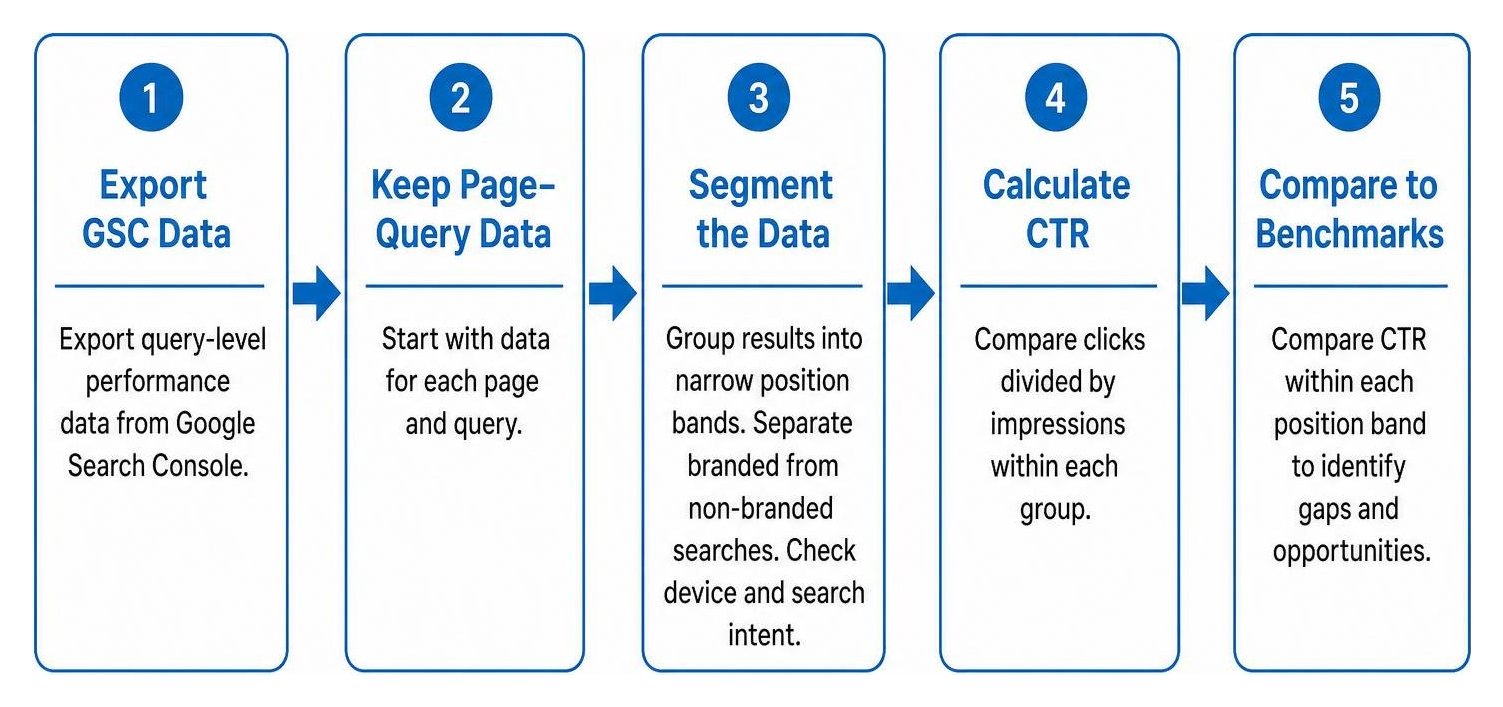
Search engines present distinct layouts across different search engine results pages. Comparing raw performance requires grouping listings by ranking position to determine whether variations in organic clicks stem from snippet copy or search page layout changes. Every query generates distinct search impressions that demand segmentation before setting performance baselines.
How to Compare Organic CTR at Similar Search Positions Using GSC Data
Exporting query-level performance data from Google Search Console provides the foundation for building custom benchmarks.
- Export query-and-page performance data over a stable 28-day finalized window (leaving a three-day buffer for data finalization).
- Filter out rows with fewer than 30 to 50 impressions to eliminate statistical noise.
- Round average positions to the nearest whole integer to create distinct ranking buckets (Position 1, Position 2, Position 3).
- Compute click-weighted CTR for each bucket by dividing total clicks by total impressions within that bucket.
Understanding the CTR curve and modeling expected click-through rate by position helps isolate snippet appeal from ranking strength.
| Search Position | Expected CTR Floor | Typical Benchmark Range |
|---|---|---|
| Position 1 | 27.6% | 27.6% – 39.8% |
| Position 2 | 15.8% | 15.8% – 18.7% |
| Position 3 | 10.1% | 10.1% – 11.5% |
| Position 4 | 7.2% | 7.2% – 8.5% |
| Position 5 | 5.1% | 5.1% – 7.2% |
| Position 6 | 3.8% | 3.8% – 5.0% |
| Position 7 | 3.1% | 3.1% – 4.2% |
| Position 8 | 2.8% | 2.8% – 3.5% |
| Position 9 | 2.6% | 2.6% – 3.0% |
| Position 10 | 2.5% | 2.5% – 2.8% |
How to Compare Organic CTR at Similar Search Positions by Segmenting Query Intent
Branded queries inflate baseline CTR numbers because searchers are already looking for your specific company. A branded query at position 1 often captures a 50% to 70% CTR, whereas a non-branded query at the same position might achieve 28%.
Long-tail terms with four or more words frequently outperform one-word searches in positions 2 through 5 by 3 to 6 percentage points because user intent is narrow and clear.
Segmenting queries by transactional, informational, and commercial intent ensures you track meaningful metrics that lead to organic conversions. Managing these segmented datasets through database systems, as detailed in this guide on tracking organic CTR metrics, prevents blended data distortion across different page types.
How Do SERP Features and AI Overviews Skew Baseline Position CTR?
Rich search features alter user behavior and reduce clicks to standard organic listings. Analysis indicates that the presence of an AI Overview reduces clicks to the top organic result by roughly 58% compared to clean layouts.
Featured snippets reduce position-1 organic CTR by an average of 5.3%, shifting users toward zero-click resolutions. Our research into how organic CTR benchmarks reveal AI Overview impacts on publisher traffic demonstrates that traditional ranking numbers no longer guarantee expected click volume.
Evaluating your listing's real estate requires tracking your overall visibility score alongside numeric rank.
Diagnosing Discrepancies and Prioritizing High-Impact CTR Fixes
When evaluating low click-through rates, prioritize fixing URLs with high impressions and substantial click gaps rather than low-volume pages.
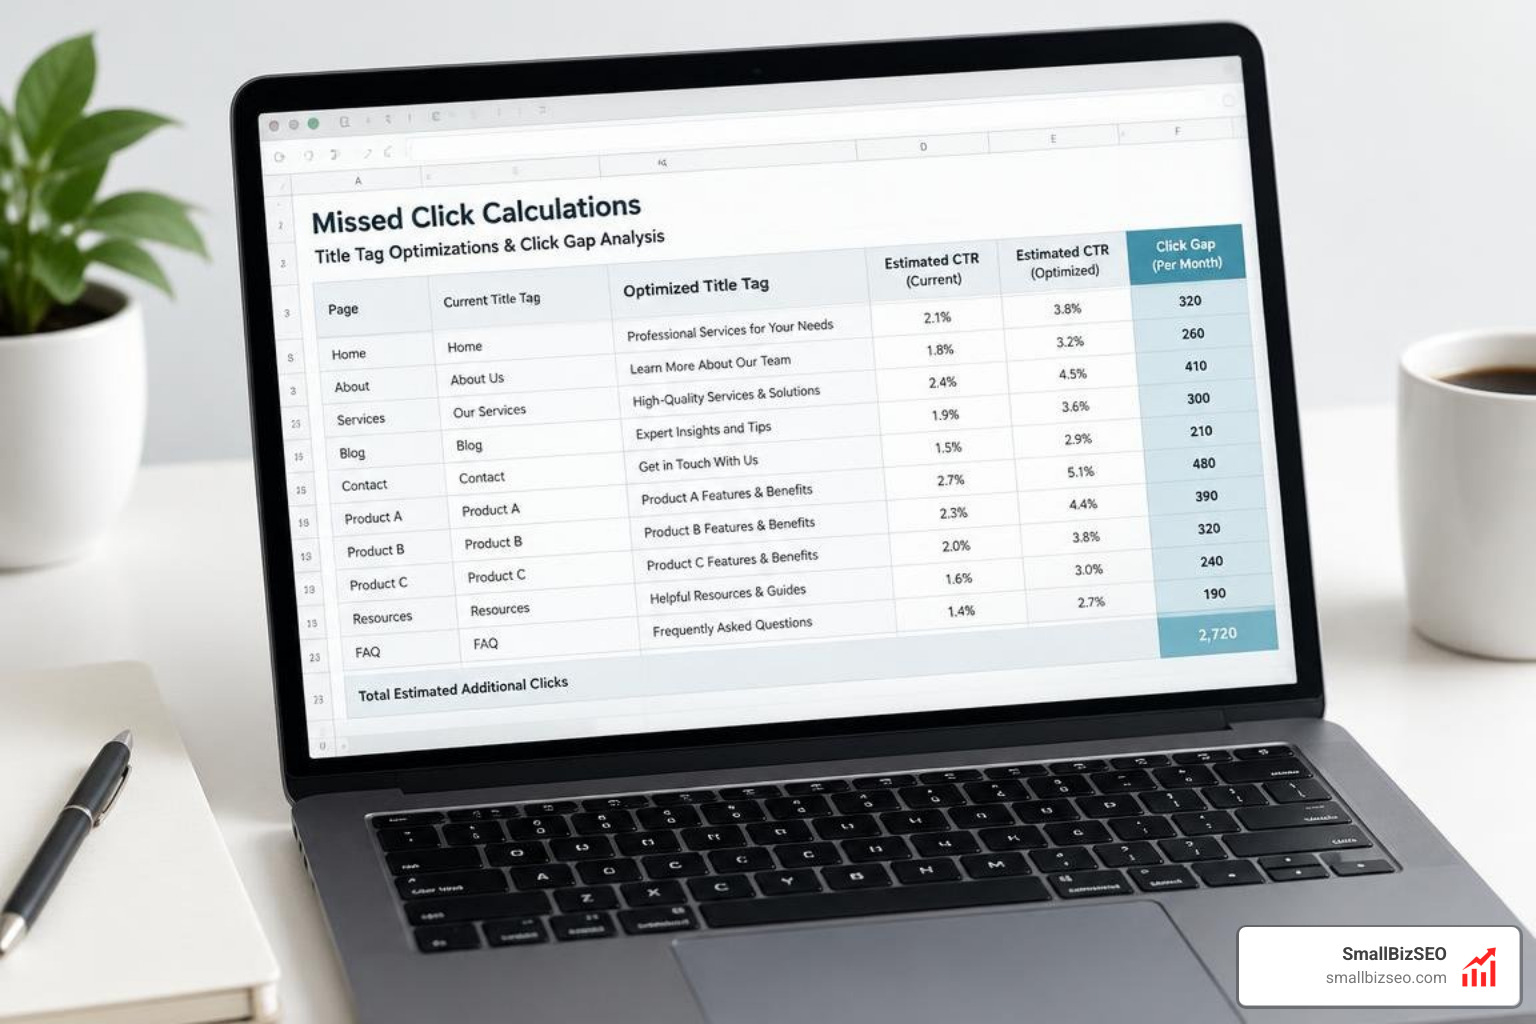
Tracking your average position across high-volume queries helps pinpoint where metadata rewrites will produce meaningful gains. Integrating reliable data from a professional rank tracker allows our team to identify when a declining click rate stems from a drop in total organic share of voice.
How Do You Calculate Missed Clicks to Identify Underperforming Snippets?
Calculate missed clicks using a straightforward formula:
Missed Clicks = (Expected Benchmark Floor CTR × Total Impressions) - Actual Clicks
If the result is zero or negative, the page meets or exceeds performance baselines. For example, if a page ranks at position 3 with 1,000 impressions and earns 40 clicks (a 4.0% CTR), compare it against the position-3 floor of 10.1%:
Missed Clicks = (0.101 × 1,000) - 40 = 61 Missed Clicks
Reviewing baseline formulas, such as those outlined in platform CTR formulas and benchmarks, confirms how this formula highlights underperforming pages.
Prioritize fixes using these core criteria:
- High impression volume (greater than 500 impressions per 28 days).
- Pages ranking within positions 1 through 5.
- The largest total gap in estimated missed clicks.
- Pure informational or commercial queries lacking heavy ad packs.
Is Low CTR at a Stable Rank a Metadata Problem or a SERP Layout Shift?
A low CTR at a stable rank indicates a metadata problem if the search layout is clean, but signals a layout shift if new search features have entered the results.
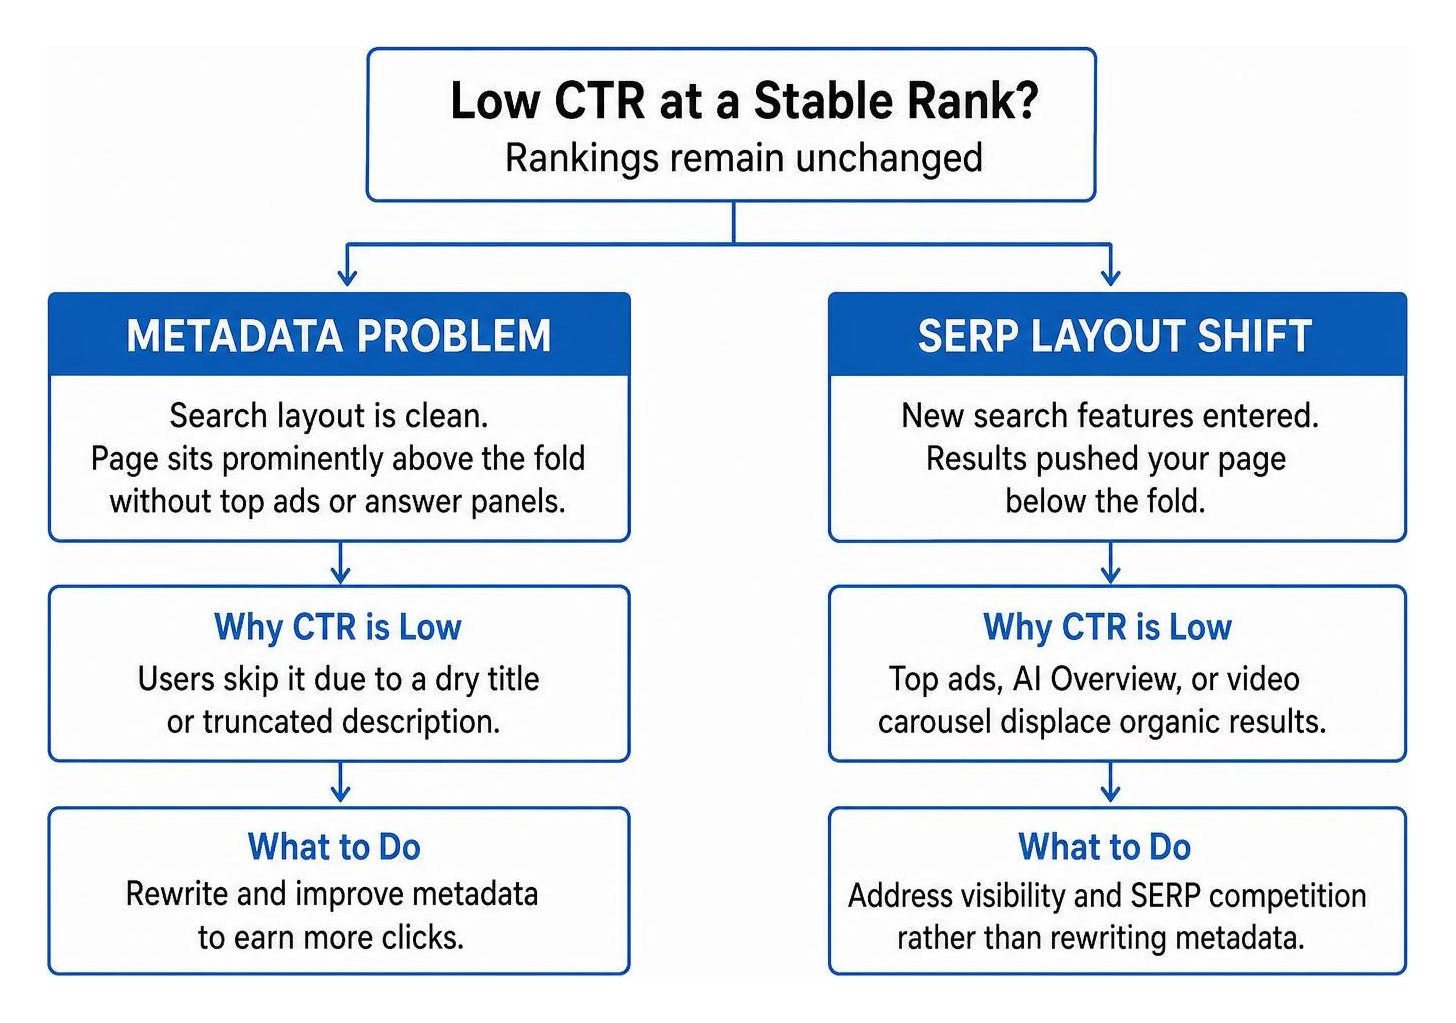
When rankings remain unchanged but click volume drops, inspect the live search result:
- Metadata Defect: The page sits prominently above the fold without top ads or answer panels, but users skip it due to a dry title or truncated description.
- SERP Layout Shift: Google added four top ads, an AI Overview, or a video carousel above the organic listings, pushing your result below the fold.
Distinguishing between these two scenarios ensures you do not rewrite effective metadata when the loss of organic users is driven entirely by visual displacement.
How Often Should You Refresh Your Position Benchmarks?
Refresh your position benchmarks monthly or quarterly to keep pace with continuous search engine updates.
Search layouts change frequently, shifting user attention and altering expected click baselines. At SmallBizSEO, we implement our data-driven "Velocity" framework to deliver fast rankings, E-E-A-T-compliant authority growth, and transparent reporting that tracks performance against custom baselines.
Reviewing your position curves regularly ensures your traffic projections match current search dynamics.
Turning Position-Level CTR Data Into Measurable Search Growth
Accurate click-through rate comparisons require moving beyond high-level site averages. By grouping data into position buckets, filtering by intent, and calculating missed clicks, you can identify which pages need optimization and which are affected by layout changes.
If your rankings are steady but organic traffic is dropping, request a professional SmallBizSEO CTR Optimization Audit to isolate underperforming snippets and recover lost clicks.