Protect Your Content Performance with Accurate Period-Over-Period Traffic Audits

How do you calculate content traffic decline over comparable periods?
Here is how to calculate content traffic decline over comparable periods: compare the same completed weeks this year and last year, using the same traffic metric for the same set of pages. Subtract current traffic from last year’s traffic, divide by last year’s traffic, then multiply by 100. If a page fell from 1,000 organic clicks to 750, its decline is 25%. Check for tracking or URL changes before treating that drop as real.
I’m Clayton Johnson, founder of SmallBizSEO, where I connect SEO and content strategy to business goals. My experience reviewing search performance shapes this guide on how to calculate content traffic decline over comparable periods and decide what to investigate next.
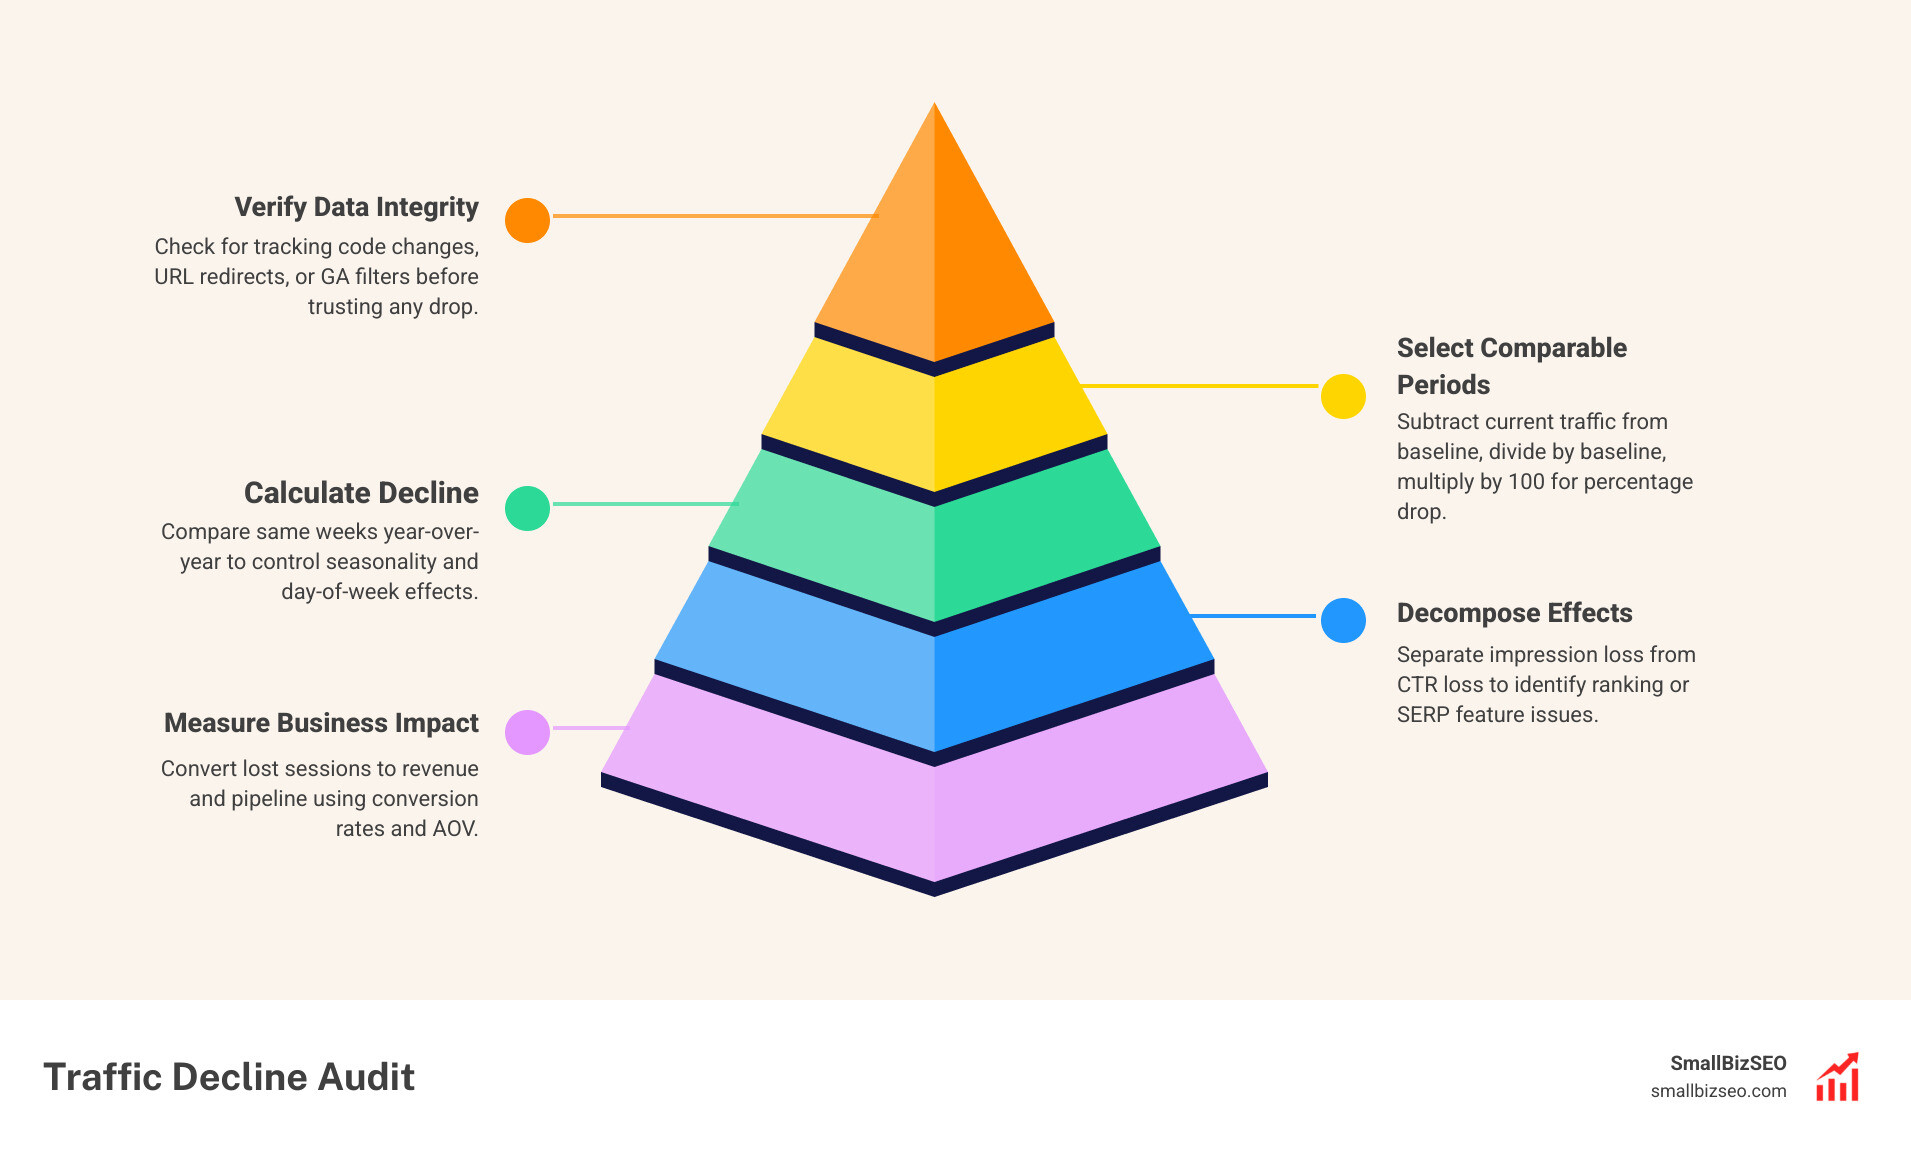
Step-by-Step Guide: How to Calculate Content Traffic Decline Over Comparable Periods
To calculate content traffic decline accurately, you must first isolate clean, comparable datasets before running any math. Traffic drops often trigger immediate panic, but calculating real performance shifts requires controlling for seasonality, day-of-week variances, and tracking integrity.
A proper Period over Period Comparison eliminates false alarms and isolates genuine traffic decay across your content portfolio.

How to Choose a Valid Baseline and Normalize Comparison Periods
A valid baseline must represent standard, unskewed traffic performance under matching calendar conditions. Comparing consecutive months (month-over-month) introduces severe distortion because of unequal calendar days, shifting holidays, and natural consumer cycles. A B2B website routinely experiences weekend traffic dips and late-winter slowdowns, while retail websites surge ahead of holidays.
To set up a fair comparison:
- Use full, completed weeks: Always compare full Monday-to-Sunday blocks to keep the day-of-week mix identical.
- Prioritize year-over-year windows: Match identical 13-week or 52-week windows from the prior cycle to neutralize seasonality.
- Align moving holidays: Ensure major holidays align within the matching analysis windows.
- Audit measurement consistency: Verify that tracking scripts, cookie consent banners, or URL migrations did not artificially depress data collection. Following a structured Google Analytics audit process ensures your baseline data remains uncompromised.
| Comparison Method | Strengths | Major Limitations | Best Use Case |
|---|---|---|---|
| Year-over-Year (YoY) | Eliminates seasonality; normalizes calendar shifts | Requires historical data; hides immediate short-term bugs | Content decay audits, annual strategy reviews |
| Month-over-Month (MoM) | Identifies recent shifts; quick feedback loop | Highly distorted by differing month lengths and holidays | Immediate post-launch monitoring, sanity checks |
| Rolling 4-Week Average | Smooths out random weekly noise | Lags behind sharp drops | Evaluating trends for newly launched content |
Before drawing conclusions, analyzing traffic changes with analytics requires ruling out measurement errors. A sudden, uniform drop across every page and channel usually signals a broken tracking snippet, not a sudden loss of search audience.
The Core Mathematical Formula: How to Calculate Content Traffic Decline Over Comparable Periods
The basic mathematical formula to calculate content traffic decline over comparable periods is:
Decline Percentage = ((Baseline Period Traffic - Current Period Traffic) / Baseline Period Traffic) × 100
For example, if an informational guide generated 12,000 organic sessions during the baseline period and fell to 9,000 sessions during the matching evaluation period:
Decline Percentage = ((12,000 - 9,000) / 12,000) × 100 = (3,000 / 12,000) × 100 = 25%
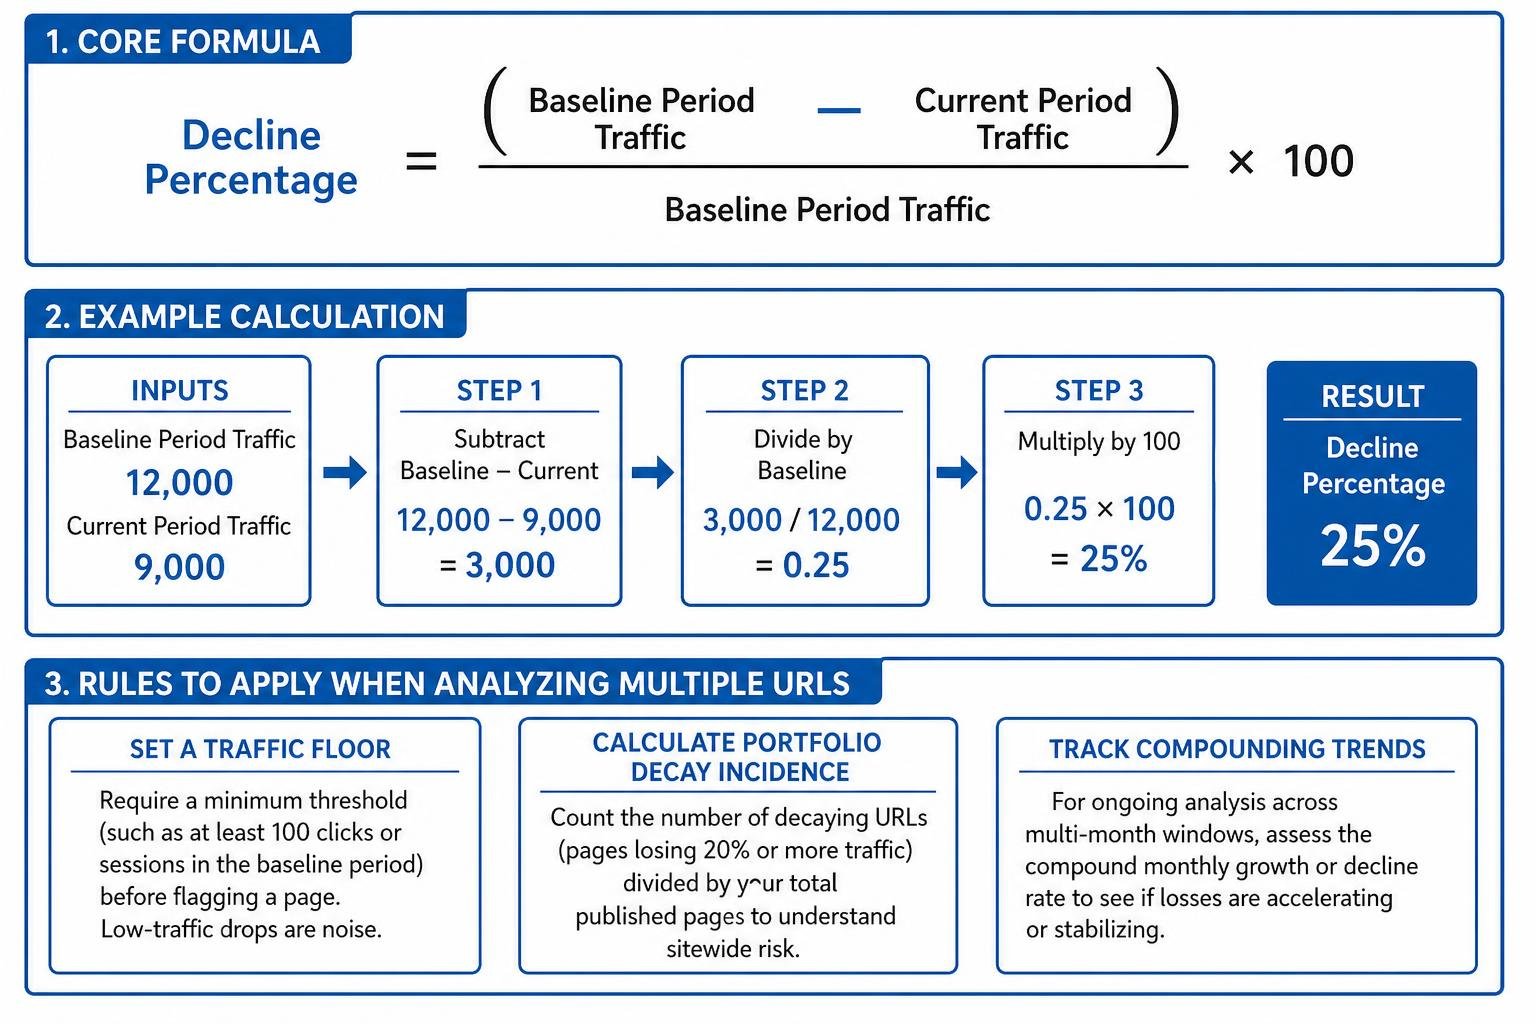
When analyzing multiple URLs, apply these additional mathematical rules:
- Set a traffic floor: Require a minimum threshold (such as at least 100 clicks or sessions in the baseline period) before flagging a page. A page dropping from 4 visits to 1 visit represents a 75% drop mathematically, but it is statistically insignificant noise.
- Calculate portfolio decay incidence: Count the number of decaying URLs (pages losing 20% or more traffic) divided by your total published pages to understand sitewide risk.
- Track compounding trends: For ongoing analysis across multi-month windows, assess the compound monthly growth or decline rate to see if losses are accelerating or stabilizing.
Applying established content decay rate formulas helps teams quickly separate pages needing simple refreshes from URLs facing structural visibility loss. Identifying systematic content decay allows you to intervene before traffic erosion impacts core business operations.
How to Calculate Content Traffic Decline Over Comparable Periods Using Google Search Console and Analytics
Google Search Console (GSC) and Google Analytics (GA4) measure different user actions, and both are necessary for a complete traffic decline audit. Search Console tracks organic clicks and impressions in search results, while Analytics measures on-site sessions and engagement.

Follow this process to cross-reference data across both platforms:
- Extract Search Console Performance Data: Navigate to the Search Results performance tab, set the date range to "Compare," and select matching custom date ranges one cycle apart. Filter by page URL to review click and impression shifts.
- Pull Matching GA4 Landing Page Sessions: In GA4, navigate to Landing Page reports, apply an organic traffic filter, and compare the exact same date ranges.
- Reconcile Discrepancies: Search Console clicks will rarely equal GA4 sessions due to ad blockers, consent choices, and redirect timing. However, the percentage decline across both tools should trend in the same direction.
- Isolate Non-Brand Queries: Segment brand terms from generic search queries to determine whether you are losing core market interest or topical rankings.
Conducting a detailed SEO analysis across both platforms confirms whether traffic drops stem from algorithm updates, lost search visibility, or internal site errors.
Diagnosing Root Causes and Measuring Business Impact
Calculating the percentage decline is only the diagnostic starting point. To restore performance, you must determine why traffic dropped and quantify what that loss means for company revenue.
How to Decompose Traffic Drops into Impression and CTR Effects
When content loses search traffic, the decline stems from one of two mathematical drivers: fewer people saw your snippet (Impression Effect), or fewer people clicked it when they saw it (CTR Effect). Decomposing click loss into these two factors reveals the root cause immediately.
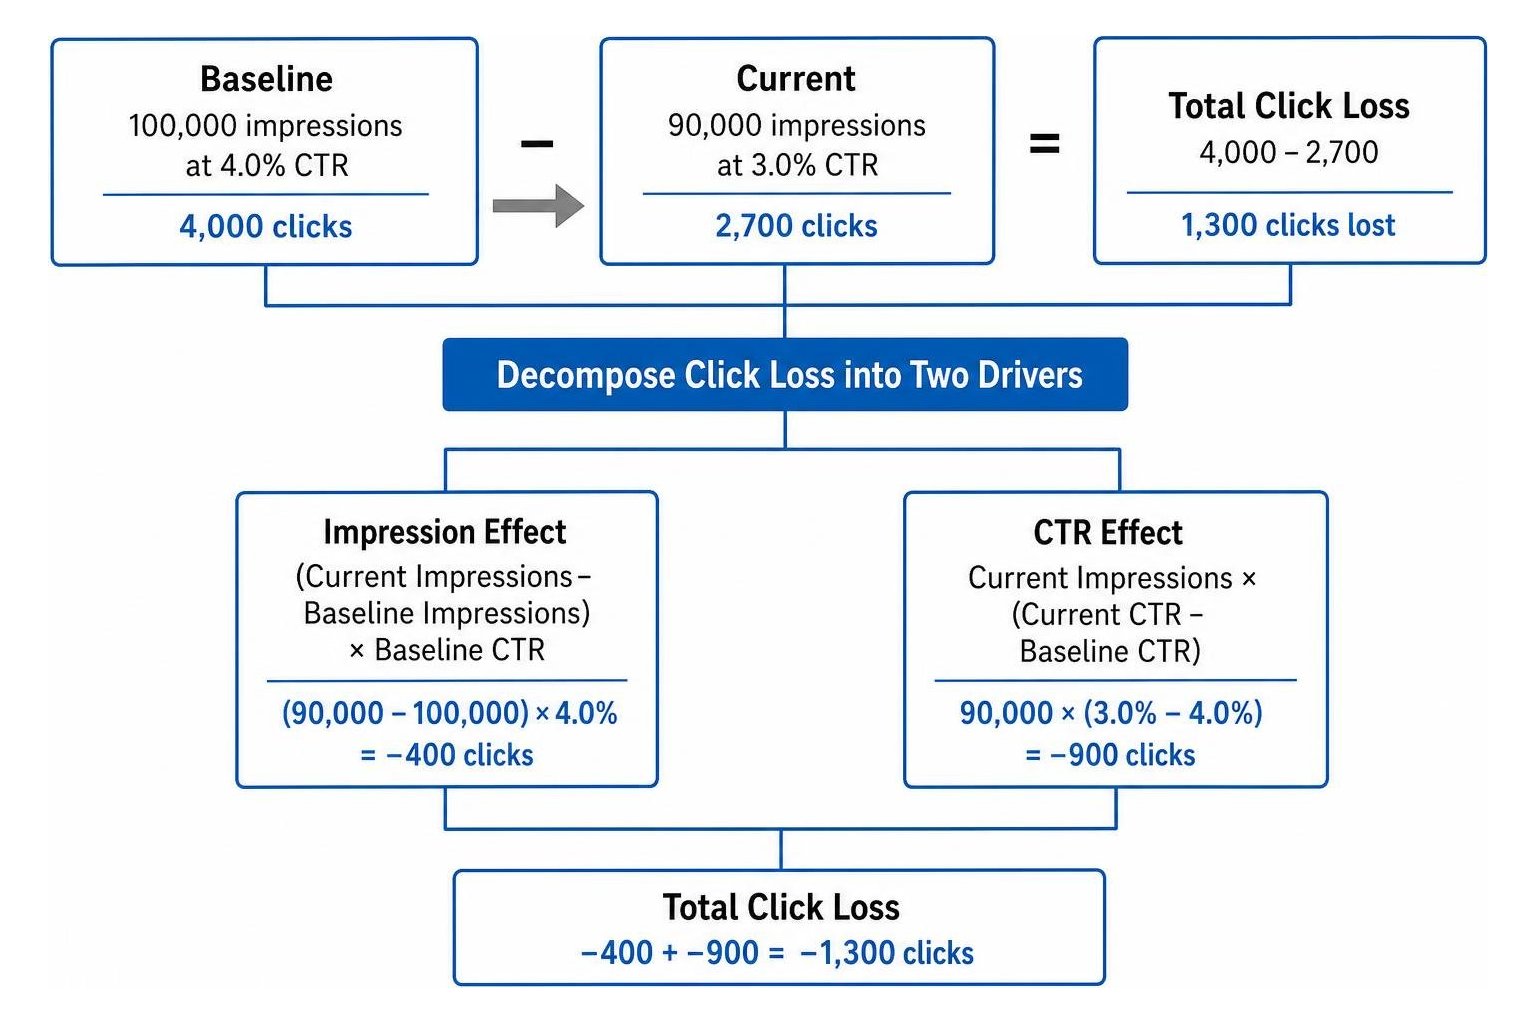
Use this decomposition framework:
- Impression Effect = (Current Impressions - Baseline Impressions) × Baseline CTR
- CTR Effect = Current Impressions × (Current CTR - Baseline CTR)
Consider a guide that previously earned 100,000 impressions at a 4.0% CTR (4,000 clicks), but now receives 90,000 impressions at a 3.0% CTR (2,700 clicks)—a total loss of 1,300 clicks:
- Impression Effect: (90,000 - 100,000) × 0.04 = -400 clicks
- CTR Effect: 90,000 × (0.03 - 0.04) = -900 clicks
In this case, roughly 69% of the lost traffic resulted from CTR erosion rather than ranking drops. This frequently occurs when search engines introduce rich answers or AI Overviews at the top of results.
Research indicates that AI Overviews appear on roughly 86% of question-format informational searches. Furthermore, pages cited within an AI Overview earn 120% more clicks per impression than uncited listings. If impressions remain flat while clicks collapse, your page likely lost visibility to new search layout features or outdated metadata.
If impressions dropped sharply, the page lost keyword rankings or total search demand declined. Performing systematic auditing dead content to revive traffic alongside ongoing keyword visibility evaluation isolates the exact queries responsible for lost exposure.
How to Calculate the Revenue and Pipeline Impact of Lost Sessions
To secure budget and prioritize updates, translate lost traffic numbers into financial terms. Multiplying traffic drops by baseline conversion rates demonstrates direct business impact.
For Ecommerce Businesses:
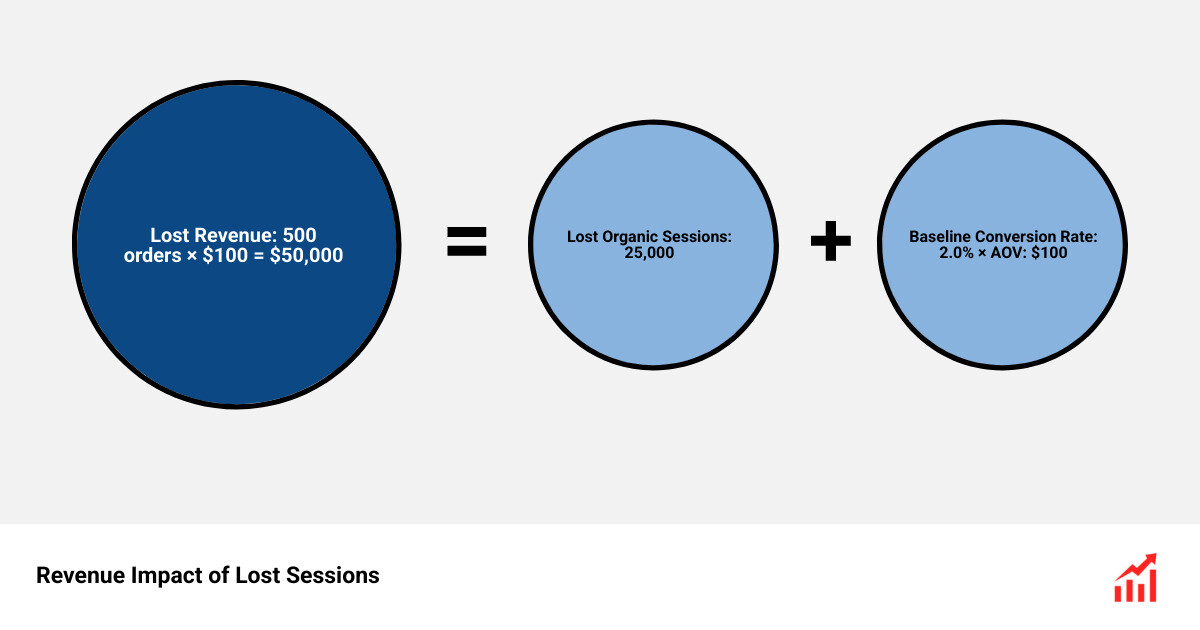
Lost Revenue = Lost Organic Sessions × Baseline Organic Conversion Rate × Baseline Average Order Value
If your blog lost 25,000 organic sessions, your baseline conversion rate is 2.0%, and your average order value (AOV) is $100:
- Lost Conversions = 25,000 × 0.02 = 500 orders
- Lost Revenue = 500 × $100 = $50,000
For Lead-Generation and B2B Businesses:
Lost Pipeline = Lost Sessions × Visitor-to-Lead Rate × Lead-to-Customer Rate × Average Deal Value
If a B2B resource section lost 10,000 sessions with a 3.0% lead conversion rate, a 10% sales close rate, and an average deal size of $5,000:
- Lost Leads = 10,000 × 0.03 = 300 leads
- Lost Customers = 300 × 0.10 = 30 customers
- Lost Revenue Pipeline = 30 × $5,000 = $150,000
Evaluating your numbers alongside evaluating assisted search conversions ensures that early-funnel blog posts are valued accurately for their contribution to closed sales.
How to Build a Recurring Content Decay Report to Prioritize Refreshes
Rather than running emergency audits after traffic crashes, establish a recurring monthly or quarterly content decay report. A recurring monitoring framework tracks decay velocity and surfaces declining URLs before revenue suffers.
Set up an automated tracking model using these filters:
- Traffic Floor: Filter for pages with at least 100 visits during the baseline period.
- Decline Threshold: Flag URLs with a 20% or greater drop over matching comparable periods.
- Publish Age Filter: Exclude URLs published within the last 12 months to avoid normal post-launch traffic settling.
- Velocity Categorization: Segment decaying pages into three action tiers:
- Slow Decay (20% to 49% drop): Queue for standard content updates and internal link optimization.
- Acute Decay (50% or greater drop): Prioritize for immediate technical audits, intent realignment, and full rewrites.
- Lost Traffic (100% drop): Investigate immediately for server errors, accidental canonical tags, or 404 status codes.
Reviewing automated SEO performance reports on a fixed schedule streamlines resource allocation across your editorial and technical teams.
Turn Traffic Loss Audits into Sustainable Growth
Diagnosing traffic decline is an essential capability for maintaining search visibility. By normalizing comparison windows, decomposing impression versus click losses, and quantifying financial impact, you transform raw analytics data into a clear recovery plan.
At SmallBizSEO, we help businesses identify hidden content decay and restore search performance through our data-driven "Velocity" framework. If your content library is losing visibility, schedule a comprehensive content decay rate audit to pinpoint declining assets and recover your organic momentum.