Understand CrUX Data Thresholds: When Origins Qualify but Pages Do Not

Why Does CrUX Show Origin Data but No Data for Your Page?
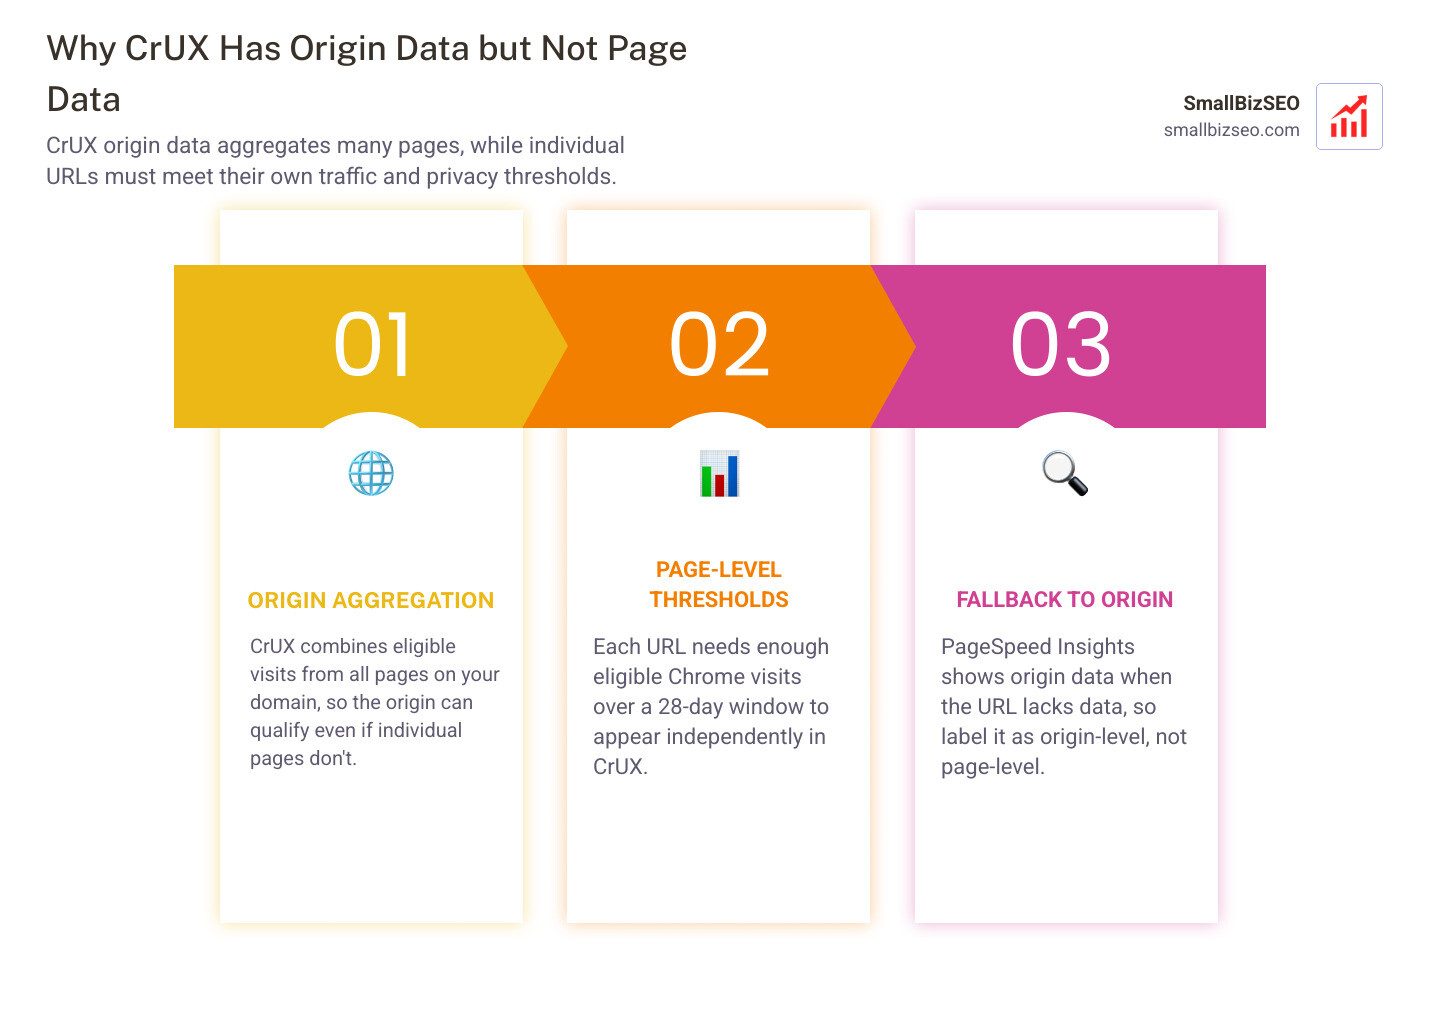
CrUX can show origin data but no data for a specific page because the origin combines eligible visits across many pages, while that URL needs enough eligible Chrome visits of its own. The page must also be publicly discoverable. Missing page data does not mean the page is slow.
To check the gap, confirm the exact URL, including https and www if used. Then check that the page loads successfully, is indexable, and receives traffic. If PageSpeed Insights shows only origin data, label it as origin-level data rather than treating it as a result for that page.
I'm Clayton Johnson, founder of SmallBizSEO, where I help small businesses make sense of technical SEO and search visibility. I explain why CrUX has origin data but no data for a specific page so owners know what to check before drawing conclusions from a report.
Why Does CrUX Have Origin Data but No Data for a Specific Page?
Origin data aggregates real-user performance across every discoverable page on your entire domain, whereas URL-level metrics require that specific URL to independently pass traffic and privacy gates.
When you analyze a URL in PageSpeed Insights, the tool first checks whether the specific page has enough logged experiences in the Chrome User Experience Report (CrUX). If the page does not meet the minimum threshold, PageSpeed Insights disables the URL tab and automatically falls back to displaying the origin-level assessment.

This aggregation model is defined in the Chrome User Experience Report methodology. The CrUX dataset collects anonymized, real-user telemetry over a rolling 28-day window. To safeguard individual privacy, Google applies strict dimension filtering and data fuzzing. If an individual page has low traffic, displaying exact histograms might risk reverse-engineering visitor behavior. Aggregating those visits into the overarching origin maintains statistical validity and privacy while still providing website owners with a broad performance signal.
Why Can Traffic Thresholds Prevent Page-Level CrUX Data?
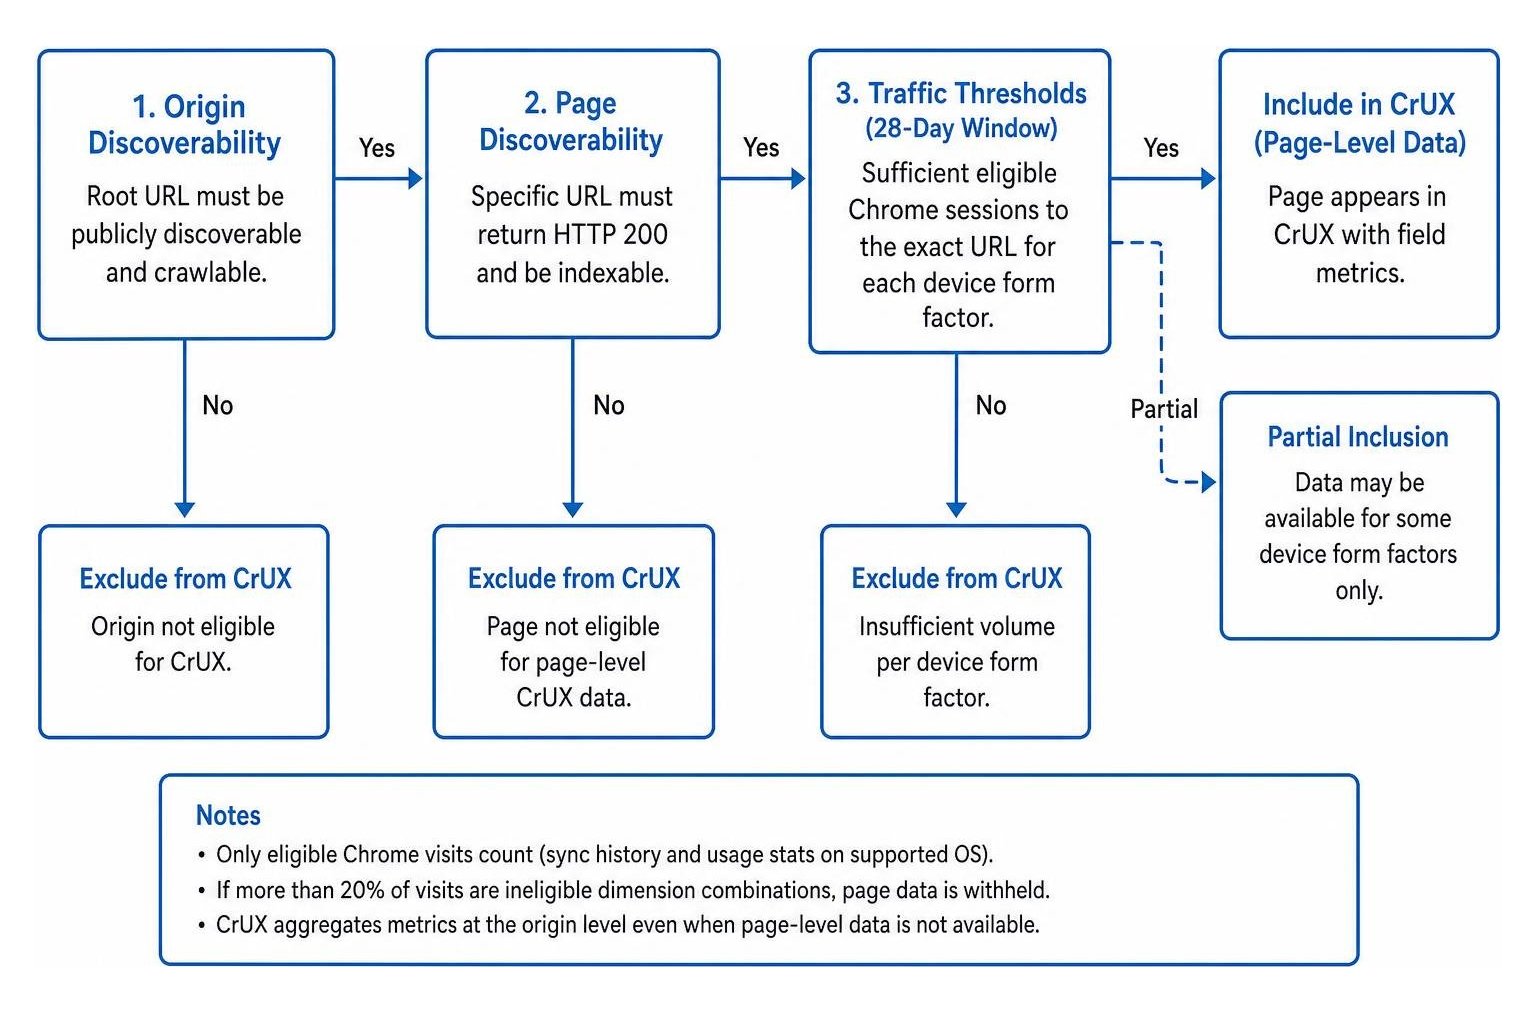
A page fails to produce individual CrUX metrics when it lacks a sufficient volume of opted-in Chrome desktop or mobile sessions over the preceding 28 days.
Only visitors who use Chrome, enable sync history, keep usage statistic reporting turned on, and browse on supported operating systems contribute to CrUX. This means raw website traffic does not equal CrUX-eligible traffic. Visits through Chrome on iOS, in-app WebViews, private browsing windows, or alternative web browsers are excluded entirely.
Understanding the differences between CrUX and synthetic RUM helps clarify why your internal analytics show thousands of pageviews while Google reports insufficient data. Furthermore, CrUX evaluates device form factors independently. If a page receives traffic mostly from desktop users but lacks mobile visits, mobile-specific metrics can be dropped entirely. If more than 20% of visits fall into ineligible dimension combinations, the page data is completely withheld from the public report.
| Requirement | Origin-Level CrUX Eligibility | Page-Level CrUX Eligibility |
|---|---|---|
| Traffic Pool | Aggregates all eligible Chrome visits across the entire domain | Measures only eligible Chrome visits to the exact URL |
| Discoverability | Root URL must be publicly discoverable and crawlable | Specific URL must return HTTP 200 and be indexable |
| Reporting Threshold | Reached easily across combined site traffic | Requires high standalone volume per device form factor |
| Form-Factor Buckets | Separate thresholds for desktop, mobile, and tablet | Requires sufficient density for each specific device |
| Rolling Window | 28-day continuous collection cycle | 28-day continuous collection cycle |
When reviewing your monthly trends, checking how to evaluate performance changes in CrUX dashboard reports helps you confirm whether your Core Web Vitals are genuinely progressing or fluctuating due to threshold boundary shifts.
What Technical and Indexing Factors Can Affect Page-Level CrUX Data?
Technical misconfigurations such as non-200 HTTP response codes, robots noindex directives, protocol mismatches, and incorrect canonical tags directly prevent CrUX from indexing page-level data.
For a URL to qualify for CrUX, it must be publicly discoverable by search engine crawlers. If a page serves a noindex meta tag, returns a 404 or 500 error code, or sits behind a login wall, Google excludes it from field data collection.
Performing comprehensive technical SEO audit protocols ensures your structural foundation meets standard eligibility. Protocols and hostnames also create hard boundaries. CrUX treats https://example.com, http://example.com, and https://www.example.com as completely separate origins. If your internal links mix these variations, your user sessions fragment across multiple targets, causing individual pages to miss their popularity cutoffs.
How Do URL Normalization, Parameters, and Redirects Affect Field Metrics?
CrUX strips query strings, UTM tracking tags, and URL fragments before aggregating metrics, which can cause traffic fragmentation if parameters change page routing or trigger redirects.
When marketing campaigns drive visitors to clean landing pages using complex parameter strings, CrUX groups the metrics under the normalized base URL. However, if those query strings lead to multi-step redirect chains or dynamically load different templates, user metrics may fail to register correctly on the intended page.
Addressing these issues is a key step when resolving critical SEO audit errors. Similarly, single-page applications (SPAs) that handle page changes with client-side routing rather than standard browser navigations often log initial load metrics under the landing URL only, leaving deeper views without field measurements.
How Can You Diagnose Data Gaps and Monitor Low-Traffic Pages?
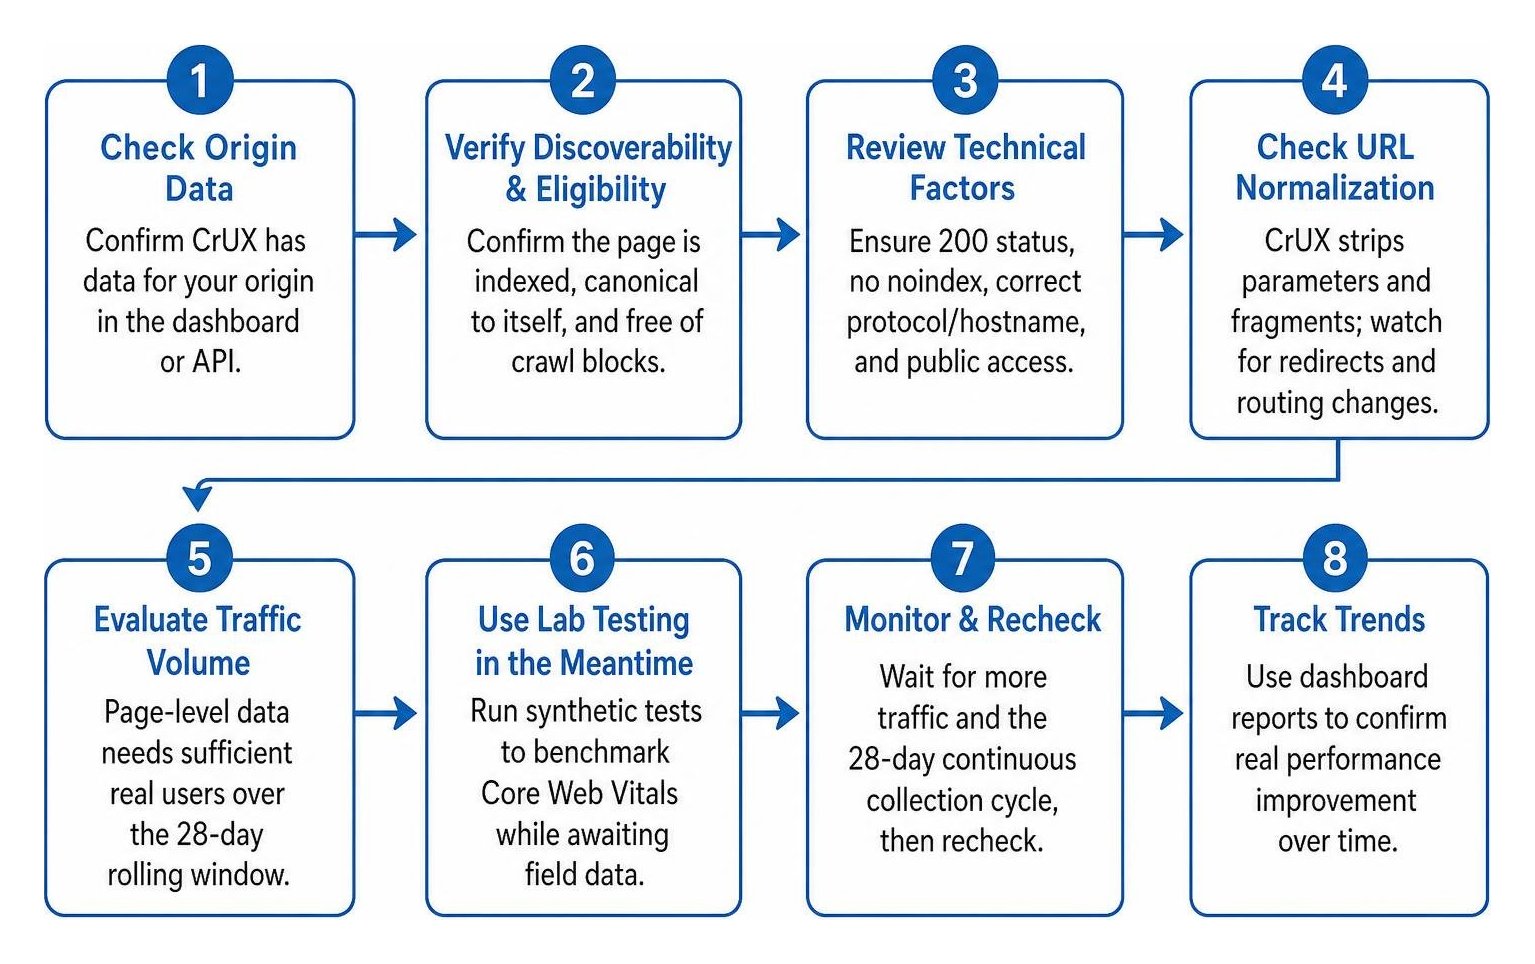
When URL-level CrUX data is unavailable, verify your technical discoverability first, confirm your origin consistency, and use synthetic lab testing to benchmark performance.

Field data provides the true picture of real-world user experience, but it requires patience and traffic volume. By querying the official CrUX API documentation, you can verify whether an endpoint returns a complete dataset, partial form-factor records, or a missing-data state. In the meantime, automated lab audits bridge the gap by simulating actual loading environments.
How Can You Verify Discoverability and Check URL Eligibility?
You can verify whether a page is eligible for CrUX by inspecting its indexing status in Google Search Console, reviewing live HTTP response headers, and testing crawl permissions.
Start by using the URL Inspection tool to confirm the page is indexed, canonicalized to itself, and free of crawl blocks. A deep understanding of search engine indexing and crawl infrastructure makes it easier to spot subtle crawl shifts that prevent CrUX inclusion.
Next, check your server cache headers to ensure you are preventing outdated page delivery to users and bots. Finally, confirm that your root domain redirects cleanly to your canonical scheme and host without looping.
What Should You Monitor When Page-Level CrUX Data Is Unavailable?
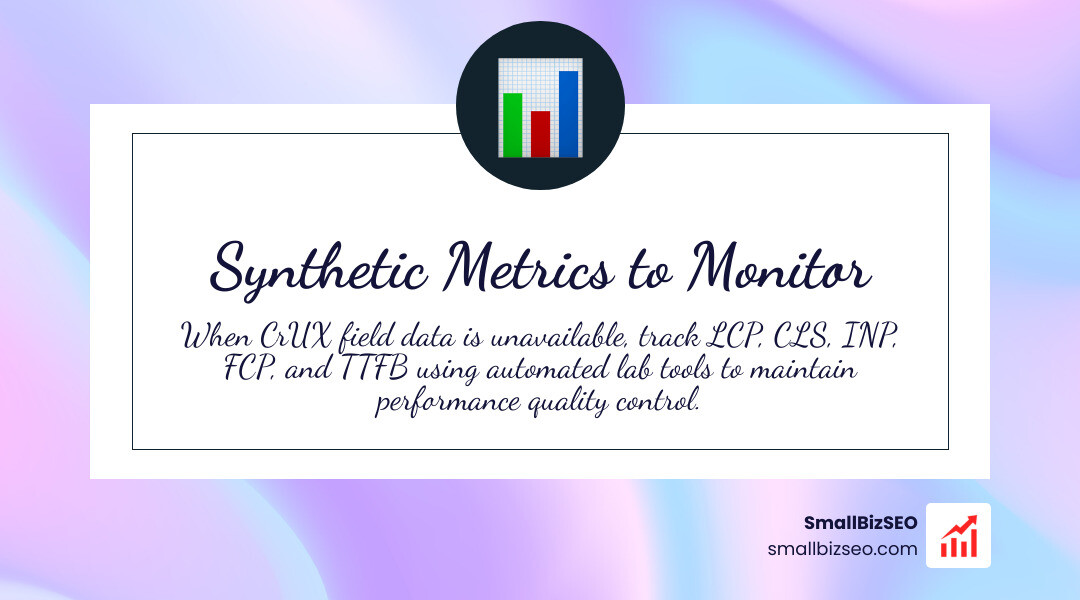
When your specific page lacks CrUX field data, monitor synthetic performance budgets and implement local browser-based tracking to maintain quality control.
- Largest Contentful Paint (LCP): Track loading speed using simulated throttled mobile network runs to catch render-blocking assets early.
- Cumulative Layout Shift (CLS): Run automated layout shift audits during page load and scroll interactions to eliminate visual instability.
- Interaction to Next Paint (INP): Test input responsiveness by simulating complex click and tap events across dynamic components.
- First Contentful Paint (FCP): Measure how quickly the browser renders initial text or images to detect early server response bottlenecks.
- Time to First Byte (TTFB): Benchmark backend server response times and CDN edge cache hit ratios across global locations.
Our team at SmallBizSEO uses our proprietary Velocity framework to help businesses build fast, indexable architectures that accelerate Core Web Vitals compliance. If you need assistance structuring your site for peak real-user performance, explore our specialized SmallBizSEO CrUX performance optimization services.
Taking Control of Missing Field Metrics on Priority Pages
Missing page-level CrUX metrics are an indicator of data eligibility thresholds, not proof of poor website speed. By diagnosing technical crawl barriers, standardizing URL structures, and using synthetic lab testing, you can optimize your user experience with confidence while your traffic volume grows toward full field eligibility. Focus on improving core loading speeds, clean up redirect pathways, and rely on aggregated origin data as a reliable guidepost for overall domain health.